The Ultimate Guide to Core Web Vitals
Core Web Vitals are a way to measure the user experience of a page. There are three Core Web Vitals:
- Largest Contentful Paint (LCP)
- First Input Delay (FID)
- Cumulative Layout Shift (CLS)
If field data shows pages score "good" for all three Core Web Vitals they pass the Core Web Vitals assessment. As of mid-June 2021, Google has started using Core Web Vitals as a ranking signal. But that's not the end of it, only the beginning. Core Web Vitals will only become more important from here on out.
In this article, we'll explain how to measure, interpret and improve your Core Web Vitals to deliver a better user experience, to ultimately make more money!
Core Web Vitals are a hot topic in the SEO community right now. For good reason: improving them makes for a better user experienceUser Experience
User experience (or UX for short) is a term used to describe the experience a user has with a product.
Learn more, and also, they are now a ranking factorRanking Factor
The term “Ranking Factors” describes the criteria applied by search engines when evaluating web pages in order to compile the rankings of their search results. Ranking factors can relate to a website’s content, technical implementation, user signals, backlink profile or any other features the search engine considers relevant. Understanding ranking factors is a prerequisite for effective search engine optimization.
Learn more for Google Search as part of the new pagePage
See Websites
Learn more experience signals. The gradual rollout began as of mid-June 2021 and was completed by September 2nd 2021.
In order to pass the Core Web Vitals assessment, you need to score “good” for all three Core Web Vitals—Largest Contentful Paint (LCP), First Input Delay (FID) and Cumulative Layout Shift (CLS)—based on field data.
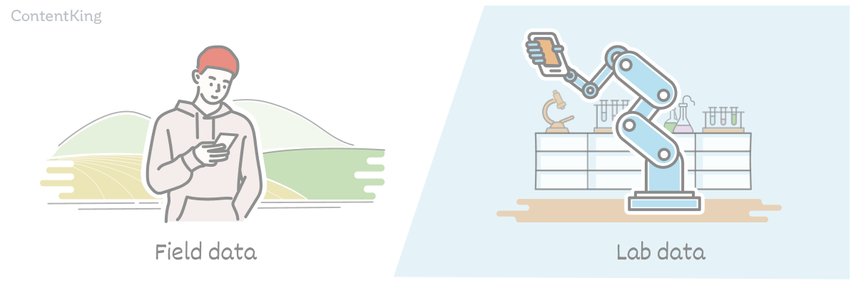
Throughout this article, we’ll frequently talk about field data and lab data. Because these are often misunderstood, we need to explain the difference right away:
- Field data is gathered from real users through the Chrome User Experience Report (“CrUX” for short).
- Lab data is gathered within a controlled environment without any involvement from real users.
Now that we have that out of the way, where do Core Web Vitals fit into Google’s ranking algorithms?
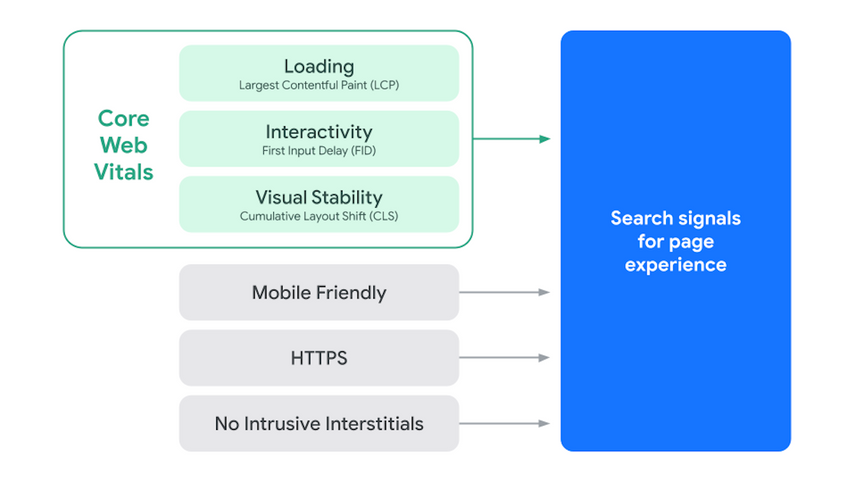
Google used to gauge user experience based on whether a site:
- is mobile-friendly
- offers HTTPS
- is free of intrusive interstitials
Now beside these three factors, they’ve added a fourth—Core Web Vitals—and together these form a group of signals that Google uses to grade “Page Experience ”, as this handy illustration shows:
It’s important to note that Core Web Vitals—both field data and lab data metrics—will be a moving target: they’re a proxy for measuring user experience, and because the web and its users are constantly evolving, it’s only natural for Core Web Vitals to evolve too.
Why this guide on Core Web Vitals?
Because there is a lot of misinformation about Core Web Vitals—and the correct information is scattered all over the place. Even Google can’t keep everything in one place. By creating this guide, we aim to provide an evergreen resource with correct information about Core Web Vitals, and where to go if you want to dig deeper.
What are Core Web Vitals?
We can already hear you reciting the famous Top Gun quote “I feel the need… the need for speed!” in your head, but the Core Web Vitals metrics are about more than just speed.
Core Web Vitals are a set of user-facing metrics related to speed, responsiveness and visual stability, to help site owners measure user experience on the web.
The Web Vitals metrics are split into Core Web Vitals and non-Core Web Vitals.
The Core Web Vitals are:
And the non-Core Web Vitals are:
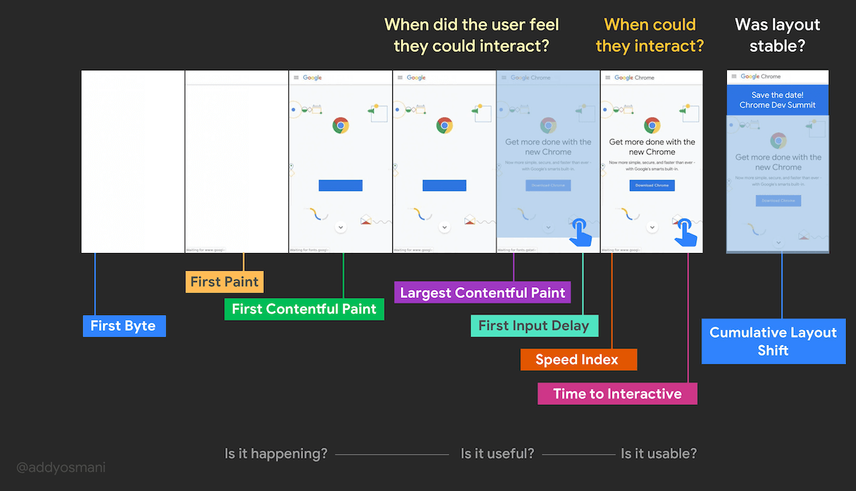
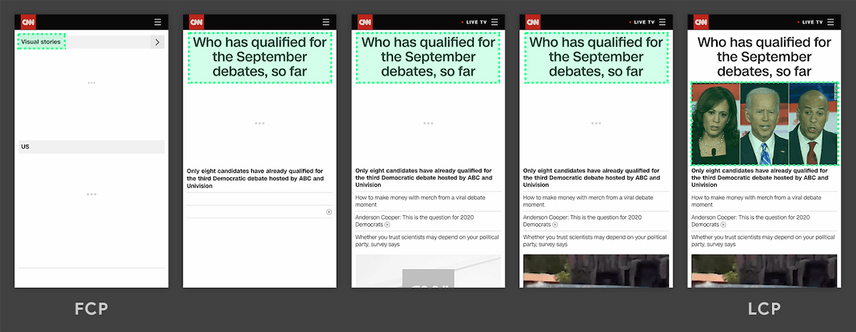
Each metric measures how “good” one part of the Page Experience is. The illustration below shows how a page loads and where the different metrics come into play:
But before we go through all the Web Vitals, we first need to explain why they are important. We want you to have all the right ammunition to present a rock-solid case when you’re making a pitch to management, or the client, about improving a site’s Core Web Vitals.
Why should you care about Core Web Vitals?
Here are the three main reasons you (and everyone) should care about Core Web Vitals:
- Visitors love fast sites that are easy and pleasant to use, on any device, from any location. The bottom line is: you’ll make more money if you’re providing a great user experience.
- As we mentioned in the introduction, Core Web Vitals have become a ranking factor as of mid-June 2021. While we don’t expect to see a big shift right away and relevance remains much more important , we expect its importance to grow over time.
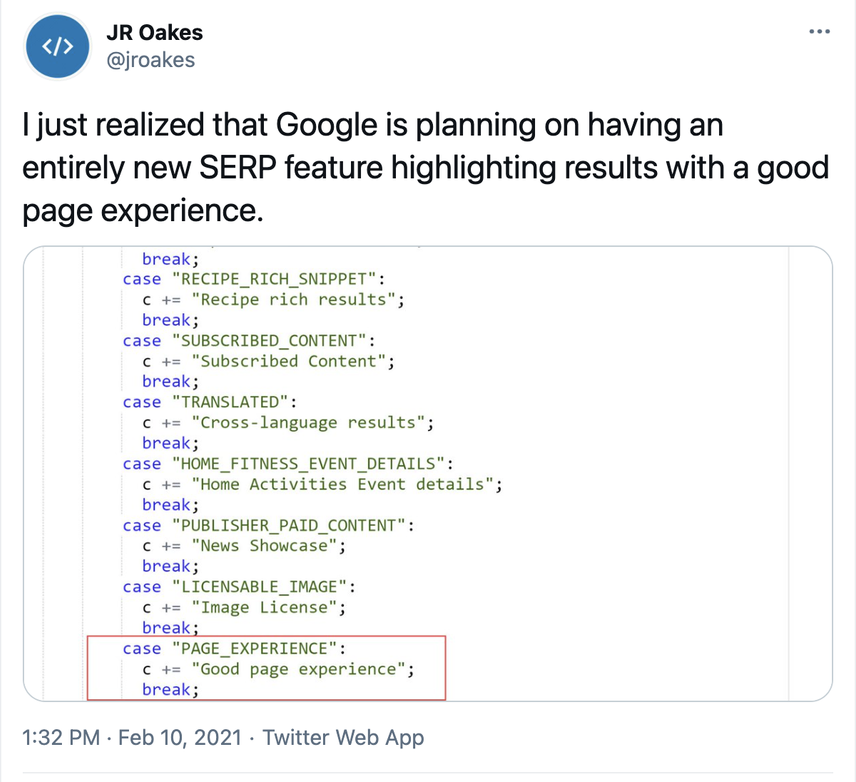
- Passing the Core Web Vitals assessment is likely to result in fewer users retreating back to the SERP, because you’re providing a good user experience—and Google has hinted they may start displaying a “Good Page Experience” badge in their search results. We call these “indirect ranking factors,” because they influence searcher behavior (e.g. more clicks for pages that have this badge), which is fed back into Google’s algorithms. In February 2021, JR Oakes was poking through Google Search Console’s front-end code when he noticed that Google may have already made some preparations in this area:
- 10 recent case studies from sites like Google, Vodafone, Yelp and Ebay show how even milliseconds can impact bounce rates, conversion rates, and ultimately your bottom line.
- And Cloudflare has collected several more such studies .
- 15 years ago, Amazon learned that their revenue increased by 1% for every 100ms decrease in load time.
- Winning at SEO with great UX

Google has long tried to push pagespeed via Pagespeed Insights and AMP. And now with Core Web Vitals, it really has become inseparable from SEO. Pagespeed optimization is just like any other part of SEO — one improvement on its own might not yield results, but after making several improvements you see a boost in your SEO performance.
For me, it's the edge cases that make the pagespeed niche interesting. For example, I've noticed million dollar revenue webshops that put A/B testing after their stylesheet doubled their First Contentful Paint. Just because of the way browsers work. And enlarging your hero image will actually improve your Largest Contentful Paint , possibly by 50% based on lab data.
Core Web Vitals in detail
Without further ado, let’s dive into each of the Web Vitals metrics, starting with the Core Web Vitals!
Largest Contentful Paint (LCP)
Largest Contentful Paint (LCP) is a Core Web Vital that measures the time in seconds from when the page starts loading to when the largest text block or image element is rendered on the screen.
Its aim is to measure when the page’s main contents have finished loading. The lower the LCP, the better. A fast LCP reassures users that a page is useful, because it’s a metric that measures perceived load speed. LCP is available in both field data and lab data.
In the field, the browser will stop reporting new LCP candidates as soon as the user interacts with the page (via tapping, scrolling, a keypress, switching tabs, or closing the tab). In the lab, it’s not entirely clear when the LCP is finished. We expect this moment to be when the page is nearing Time to Interactive (TTI), and it’s clear which element is the final LCP candidate.
Important considerations
While a page is loading, the largest text block or image element may change, and the most recent candidate is used when measuring the LCP.
For example, consider when at the start an H1 heading is the largest text block, but later on a larger image is loaded. The larger image is then the leading candidate in measuring the LCP.
Please note that <svg> elements are currently not considered candidates for the Largest Contentful Paint. So if you’re loading a big logo as an <svg> element, it won’t be considered a LCP candidate. This was decided to keep things simple, and may change in the future.
It’s unclear whether <video> elements are currently considered LCP candidates; we’ve reached out to Google for clarification.

"What should be my LCP element?" should always be the first question to answer when working on optimizing your LCP.
When working on LCP optimization I'm finding that, in most cases, the LCP element isn't the page's most important content. Instead, it's the cookie consent banner or a promotional banner/modal. Do these elements reflect the useful content? No!
So the first step is to write down the most eligible LCP candidates for each page type. For example, for a blogpost, they could be the h1, the cover image and the first paragraph of the article. For a product details page, they could be the product image, name and the price. You can fill in a table listing all the page types LCP candidates and discuss it with the team.
The second step is then to prioritize the elements of our LCP candidates. The aim is to display them as fast as possible.
How to interpret your LCP score
Here’s how to interpret your LCP score:
- Good:
<= 2.5s(2.5 seconds or less) - Needs improvement:
> 2.5s <= 4s(between 2.5 and 4 seconds) - Poor:
> 4s(more than 4 seconds)
What could be causing a poor LCP score
There could be any of a myriad of causes for a poor LCP score, for example slow server response times, render-blocking JavaScript and CSS, and having your largest content resources be too heavy, requiring too much time to load.
![Sophie Gibson, Technical SEO Director, [object Object]](https://cdn.sanity.io/images/tkl0o0xu/production/edb5f46855ebe42ef4b7553dc94dfafd03430035-400x400.jpg?dpr=1&fit=min&h=100&q=95&w=100)
Improving the Largest Contentful Paint metric is one of the more difficult Core Web Vitals to troubleshoot, as there is such a large range of factors which can affect this.
Investigating the initial server response times is a good way to assess whether you have any underlying infrastructure issues which may affect TTFB, and therefore impact LCP scores.
To see what your initial baseline is, find (or create) a blank / static HTML page, which typically should mean that there is no server-side processing needing to happen before the page can be displayed, and use this URL to run through your measurement tool of choice.
If this static page still has an high initial server response time, this means you may need to look at the site's infrastructure - upgrading your hosting platform and look into using a CDN to improve scores across the site — or it could be a firewall or DNS setting.
This process will also give you a benchmark figure which would be the lowest number you could expect to see if no server improvements are able to be made.
Improving your LCP score
You can do lots of things to improve your LCP score—for example optimizing your critical rendering path, CSS, and images. Describing all of them is far beyond the scope of this article. So we recommend checking out web.dev’s resources on optimizing LCP scores instead.
- Largest Contentful Paint (LCP) explained by web.dev.

A large TTFB can really add to LCP issues, however there is one thing to be careful of when reporting TTFB issues to developers:
The Lighthouse audit used by PageSpeed Insights and GTMetrix (on default mobile settings) adds artificial latency to any interaction with the server, meaning something with multiple handshakes like TTFB can look drastically worse when rate limited.
To test for TTFB without using a third party tool, you can use the command-line tool cURL and the
--write-out/-w argument, e.g:curl -w "%{time_starttransfer}\n" https://www.example.com -o /dev/null
First Input Delay (FID)
First Input Delay (FID) is a Core Web Vital that measures the time in milliseconds from when a user first interacts with your site (i.e. when they click a link, tap a button, or press a key) to when the browser is able to respond to that interaction.
The FID underlies a user’s first impression of your site's interactivity and responsiveness. Better make it a good impression!
As the description of this metric suggests, it is one that can only be measured in the field, as it relies on user interaction. Therefore, the FID is only available in field data. The lower the FID, the better.
For testing within the lab, the Total Blocking Time metric is used, as it closely correlates with First Input Delay.
Important considerations
The FID does not measure the time it takes the browser to process an event (e.g. a tap on a button), nor the time it takes to update the user interface after that.
Interactions such as scrolling and zooming aren’t counted as actions, because they’re continuous in nature and have very different performance constraints because the scrolling action is performed by the GPU instead of the CPU, or the CPU's compositor thread instead of main thread.
How to interpret your FID score
Here’s how to interpret your FID score:
- Good:
<= 100ms - Needs improvement:
> 100ms and <= 300ms - Poor:
> 300ms
What could be causing a poor FID score
One common reason for a poor FID score is that a browser’s main thread is busy parsing and executing JavaScript code. When the main thread is busy, it can’t yet respond to a user’s interaction.
Improving your FID score
If you want to improve your FID score, you need to look closely at what’s keeping the browser from going interactive. Examples of things you can do to improve your FID score are:
- Reducing JavaScript execution time.
- Minimizing work done in the main thread.
- Reducing the impact of third-party code.
Describing the ins and outs of improving your FID score is beyond the scope of this article. So we recommend checking out web.dev’s resources on optimizing FID scores .
- First Input Delay (FID) explained by web.dev.
Cumulative Layout Shift (CLS)
Cumulative Layout Shift (CLS) is a Core Web Vital that measures the cumulative score of all unexpected layout shifts within the viewport that occur during a page’s entire lifecycle.
Its aim is to measure a page’s “visual stability,” as that heavily influences the user experience. CLS is available in both field data and lab data. The lower the CLS score, the better the visual stability.
CLS isn’t measured in seconds like most of the other metrics. It works from the viewport size, relates to elements that move between two frames—called unstable elements—and measures their movement in the viewport. The layout shift score is a product of two components: the “impact fraction” and the “distance fraction”.
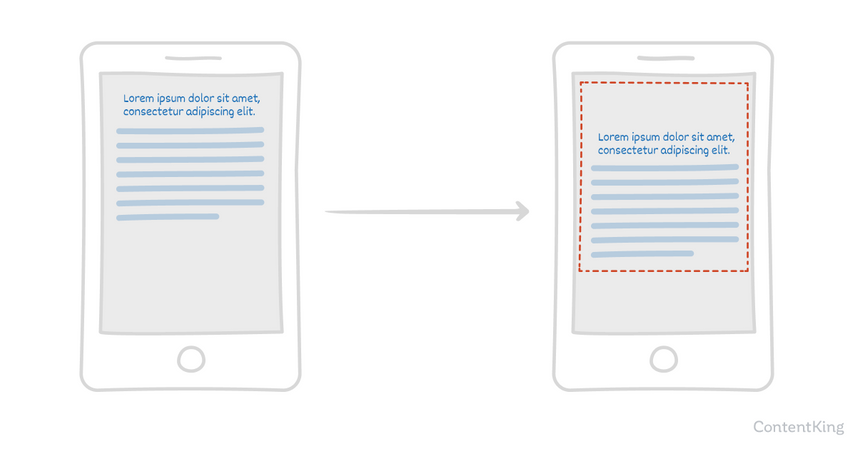
The “impact fraction” is the area of the viewport that the unstable element takes up in both frames:
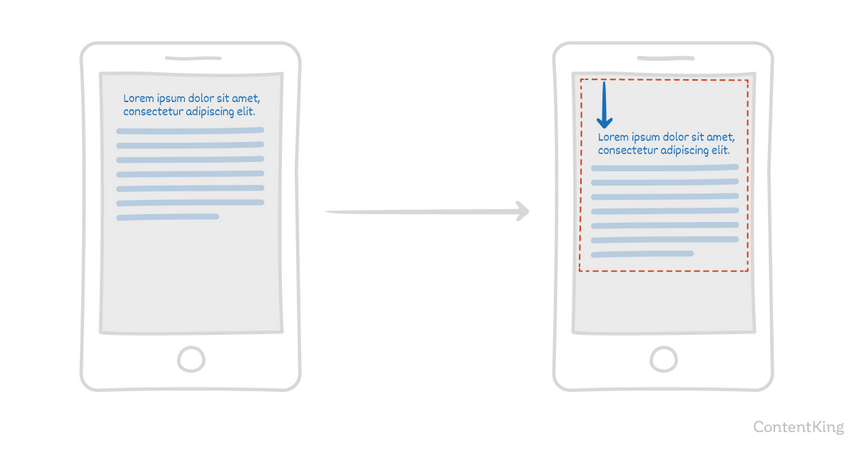
The “distance fraction” is the greatest distance the unstable element moves between both frames, divided by the viewport’s largest dimension (width or height):
You’ll find several examples to build an even better understanding of how CLS is calculated here .
Important considerations
“A page’s entire lifecycle” means that when the page remains open for days, or even weeks, the CLS is measured the entire time. Obviously, this is where CLS field data and lab data will report differences, because tools only gather lab data for a very brief period.
Correctly testing for unexpected layout shifts in test environments can prove tricky, because some functionality may be disabled or work differently there. Some examples: cookie notifications may not be shown, live chat support may be disabled, and personalized content will not be loaded.
How to interpret your CLS score
Here’s how to interpret your CLS score:
- Good:
<= 0.1 - Needs improvement:
> 0.1 <= 0.25 - Poor:
> 0.25
What could be causing a poor CLS score
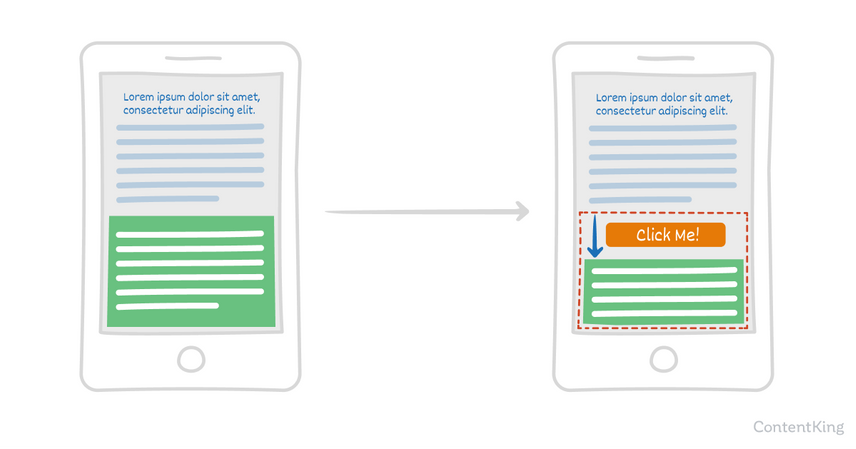
Unexpected layout shifts often happen because of images or ads with undefined dimensions, resources that are loaded asynchronously, and situations where new DOM elements are dynamically added to a page, above existing content that has already been loaded. This results in content that has already been loaded being pushed away.

When we audit the CLS for a client website, we always examine the Performance recording in Chrome DevTools to spot layout shifts on a page. Under the Performance tab, we ensure Screenshots and Web Vitals are enabled and start profiling by hitting the preload button.
Once that is complete, the Experience section (only shown if there are layout shifts) reveals the exact occurrences of layout shifts, in the form of red blocks. When selecting these Layout Shift blocks, we are provided with helpful information (found in the Summary tab), including the related node that experienced the shift and its Cumulative Score. The screenshots shown at the top of the Performance profile can also provide a useful visualisation of the elements experiencing a shift.
Improving your CLS score
You can prevent unexpected layout shifts e.g. by always including size attributes for your images and videos and by not inserting content above other content that’s already loaded. We recommend checking out web.dev’s article on optimizing CLS scores to learn the full range of improvements you can make.
- Lifecycle of a page explained
- Cumulative Layout Shift (CLS) explained by web.dev.
- Find & Fix Layout Shifts by Smashing Magazine
Total Blocking Time (TBT)
Total Blocking Time (TBT) is a non-Core Web Vital that measures the total time in milliseconds between First Contentful Paint (FCP) and Time To Interactive (TTI) where the main thread is blocked long enough to make it unresponsive to user input.
TBT highly correlates with First Input Delay (FID), and is therefore considered the best alternative when testing in a lab environment where real user interaction isn’t possible. While TBT can be gathered in the field, it’s easily influenced by user interaction and doesn’t make for a reliable metric to measure how long it takes for a page to become responsive to user input. Therefore, TBT is only used in lab data.
Any task that takes more than 50ms to execute is considered a long task, and the time on top of the 50ms is considered the “blocking time”. TBT is calculated by taking the sum of the blocking portion of all long tasks. For example, if there are three long tasks:
- Task A takes 75ms (25ms longer than 50ms)
- Task B takes 60ms (10ms longer than 50ms)
- Task C takes 85ms (35ms longer than 50ms)
The TBT is then: 70ms (25+10+35). The lower the TBT, the better.
How to interpret your TBT score
Here’s how to interpret your TBT score:
- Good:
<= 200ms - Needs improvement:
> 200ms <= 600ms - Poor:
> 600ms
Causes for a poor TBT score and how to improve it
The section Improving your FID score above and How to Improve your TBT score explain in detail what causes a poor TBT score, and how to improve it.
- Total Blocking Time (TBT) explained by web.dev.
First Contentful Paint (FCP)
First Contentful Paint (FCP) is a non-Core Web Vital that measures the time from when a page starts loading to when any part of that page’s content is rendered on the screen. Having a fast FCP reassures users that something is happening. Within this context, content means text, images (including background images), <svg> elements, and non-white <canvas> elements.
FCP is available in both field data and lab data, and the lower the FCP, the better.
How to interpret your FCP score
Here’s how to interpret your FCP score:
- Good:
<= 1.8s - Needs improvement:
> 1.8s <= 3s - Poor:
> 3s
What could be causing a poor FCP score
Common causes for a poor FCP score are high server response times and render-blocking resources.
Improving your FCP score
You can do a lot of things to improve your FCP score, for example eliminating render-blocking resources, removing unused CSS, minifying CSS, and using a CDN.
The topic of improving your FCP score really deserves an article of its own. Until we write one, we highly recommend you check out web.dev’s resources on optimizing FCP scores .
- First Contentful Paint (FCP) explained by web.dev.
- 10 Ways To Improve First Contentful Paint by WP Rocket.
Speed Index (SI)
Speed IndexIndex
An index is another name for the database used by a search engine. Indexes contain the information on all the websites that Google (or any other search engine) was able to find. If a website is not in a search engine’s index, users will not be able to find it.
Learn more (SI) is a non-Core Web Vital that measures how quickly the contents of a page are visibly populated during page load. It’s calculated using frame-by-frameFrame
Frames can be laid down in HTML code to create clear structures for a website’s content.
Learn more analysis of your page’s load behavior, counting the visual progression between frames captured every 100ms.
SI is available in both field data and lab data.
How to interpret your SI score
Here’s how to interpret your SI score:
- Good:
<= 3.4s - Needs improvement:
> 3.4s <= 5.8s - Poor:
> 5.8s
What could be causing a poor SI score
Anything preventing the page from loading quickly will hurt your SI score. Some of the causes that are mentioned for the other metrics, such as for example the main thread being blocked, apply here too.
Improving your SI score
If you focus on improving overall page load performance, you’ll see your SI score improve too. We recommend checking out web.dev’s resource on this here .
- Speed Index (SI) explained by web.dev.
Time to Interactive (TTI)
Time to Interactive (TTI) is a non-Core Web Vital that measures the time from when the page starts loading to when it's fully interactive.
For it to be fully interactive, it needs to:
- Display useful content (measured by First Contentful Paint).
- Have most visible page elements rendered.
- Respond to user interactions within 50 ms.
While it’s possible to measure TTI in the field, it’s not recommended, because user interaction can heavily influence your page’s TTI. Therefore, you should only use TTI from a lab data environment.
How to interpret your TTI score
Here’s how to interpret your TTI score:
- Good:
<= 3.8s - Needs improvement:
> 3.8s <= 7.3s - Poor:
> 7.3s
What could be causing a poor TTI score
Similarly to the Speed Index metric above, many of the things causing poor scores in the other metrics we described apply to TTI too, because it’s a metric that encompasses those other metrics.
Improving your TTI score
We recommend checking out this web.dev article for next steps on how to improve your TTI.
- Time to Interactive (General explanation) by web.dev.
- Time to Interactive (Lighthouse metric) explained by web.dev.
Comparing apples to apples
When it comes to Core Web Vitals data, it’s essential that we compare apples to apples. That’s why we need to hammer down the differences between field data and lab data, as well as mobile data and desktop data.
Field data vs. lab data
There are two types of data:
- Field data is collected from from real users. Each with their unique device and network connection, through the Chrome User Experience Report (“CrUX report” for short).
- Lab data is not collected from real users. It's collected within a controlled environment with a predefined device and network connection settings.
It’s essential that you understand the difference between these two data types. Take a second to let it sink in, as it is perhaps the most commonly misunderstood aspect of Core Web Vitals metrics.
You may be getting great scores in Lighthouse (lab data) and be high-fiving yourself, while your actual users are having a poor user experience (field data). Alternatively, you can have the same in reverse—great scores based on field data and poor lab data scores!
Then there’s the “Origin Summary” which is based on field data representing the aggregate experience of all pages served from your site. Note that if you have some specific page templates that load notoriously slowly, this will hurt your Origin Summary score.
Web Vitals metrics and availability
Here’s a handy overview of Web Vitals metrics’ availability in field and lab data:
Field data | Lab data | |
|---|---|---|
Largest Contentful Paint (LCP) | ||
First Input Delay (FID) | ||
Cumulative Layout Shift (CLS) | ||
Total Blocking Time (TBT) | ||
First Contentful Paint (FCP) | ||
Speed Index (SI) | ||
Time to Interactive (TTI) |
What else you need to know about field data
Field data:
- May not be available for your pages if they aren’t getting enough visitors, meaning not enough CrUX data. This goes for both individual URLs and your Origin Summary.
- Is less useful for debugging, because after you make some improvements, you’ll need to wait for new CrUX data to come rolling in. Therefore, we recommend relying on lab data for debugging purposes.
- Includes data from markets you’re not necessarily catering to, as well. For example, if you’re primarily targeting the United States, but you’re getting a lot of traffic from emerging markets that don’t have the same access to fast internet and hardware, you’re going to see very mixed field data, simply because the audience your field data is collected from is also very mixed.
- May also include data from non-indexable pages such as PPC landing pages (source) .
What else you need to know about lab data
Lab data:
- Is collected (as of April 2021) by emulating a Moto G4 mobile phone with a fast 3G connection.
- Doesn’t include user interaction data, because lab data is simulated. That’s why First Input Delay (FID) isn’t available in lab environments.
- Produces reproducible results, because you control the hardware and settings (internet connection and CPU performance).
Field data vs. Lab data summarized
Field data | Lab data | |
|---|---|---|
Data origin | Real users | Simulated users |
Data freshness | Gathered in last 28 days | Collected in real time |
Device | Unique to each user | One device (default: Moto G4) |
Network connection | Unique, across all users | One network connection speed |
Locations | Unique, across all users | One location |
Main purpose | Gain insight on real user experiences | Debug and test |

I'd advise you to look at as much field data as you can for the initial analysis to better understand the issues affecting your site's user experience. After you gain enough insights from the field data, leverage the lab data for actual testing and debugging. Bear in mind that the lab data will vary based on your internet connection, device, location, etc., so don't sweat if you get different results each time you test your site.
Clearly communicating your findings to other teams -from UX experts to developers— is essential here. When it comes to user experience (especially on large eCommerce sites), you can only achieve success if the entire team works in synergy.
Mobile data vs. desktop data
You’ll come across mobile data, desktop data, and a mix of both when researching your Core Web Vitals’ scores.
You can see the field data for mobile and desktop separately in PageSpeed Insights and Google Search ConsoleGoogle Search Console
The Google Search Console is a free web analysis tool offered by Google.
Learn more and by exploring the CrUX data via BigQuery and the CrUX Dashboard .
It’s common to see your desktop scores being better than your mobile scores. It just makes sense, considering that a desktop device often has better hardware and a faster, more reliable internet connection.
Tools to measure your Core Web Vitals
Now that we’ve explained the Web Vitals metrics and the differences between field data and lab data, and desktop and mobile data, let’s go through the most popular tools and see what our Web Vitals look like through:
ContentKing
ContentKing monitors websites in real-time, keeps track of content changes and flags SEO issues as they happen. In case of trouble, you'll be alerted.
When it comes to Core Web Vitals, the ContentKing platform monitors your site's Origin Summary (field data) and Lighthouse metrics (lab data) for all of your pages.
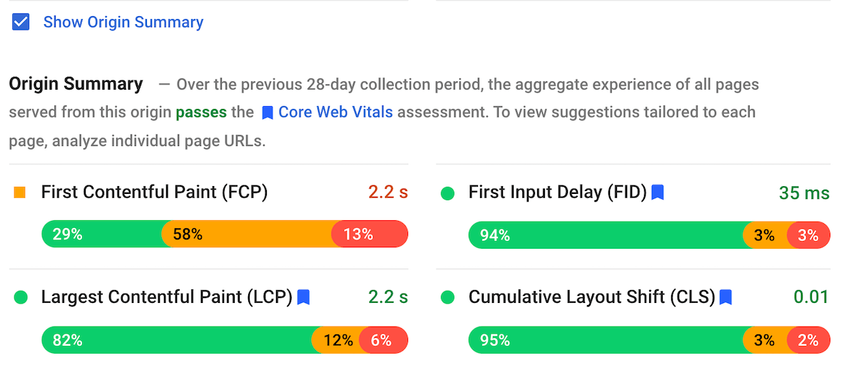
Origin Summary
The Origin Summary is an aggregate across all pages on your site, making it a great metric to quickly check how your site's overall Core Web Vitals are looking:
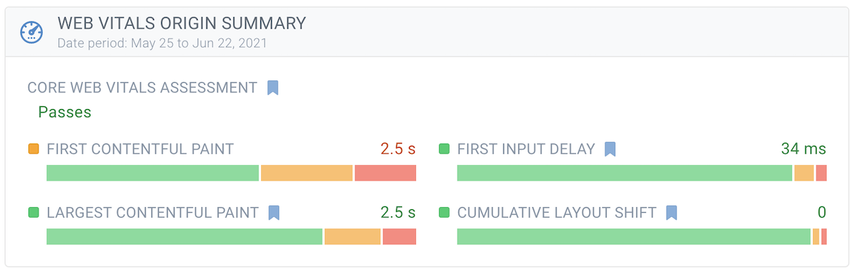
In this example, the Core Web Vitals assessment is passed.
From there, you can drill down to see what improvements you can still make:
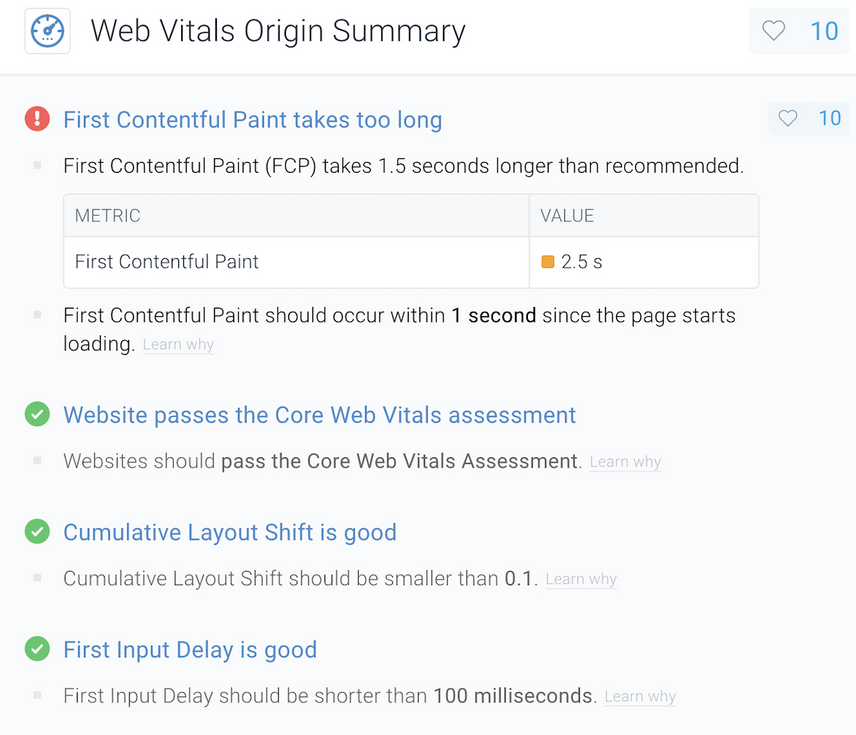
While First Contentful Paint isn't a Core Web Vitals metric at the moment, it is an important indicator for perceived load time.
On top of that, we think Google will make First Contentful Paint a Core Web Vital in the future, or at the very least increase its importance even more.
Lighthouse Monitoring
Lighthouse is an open-source initiative that diagnoses pages, helping you to improve their performance based on lab data. Lighthouse is used by various web performance tools (such as PageSpeed Insights, Web.dev Measure and ContentKing).
ContentKing monitors your Lighthouse scores across all of your pages on auto-pilot.
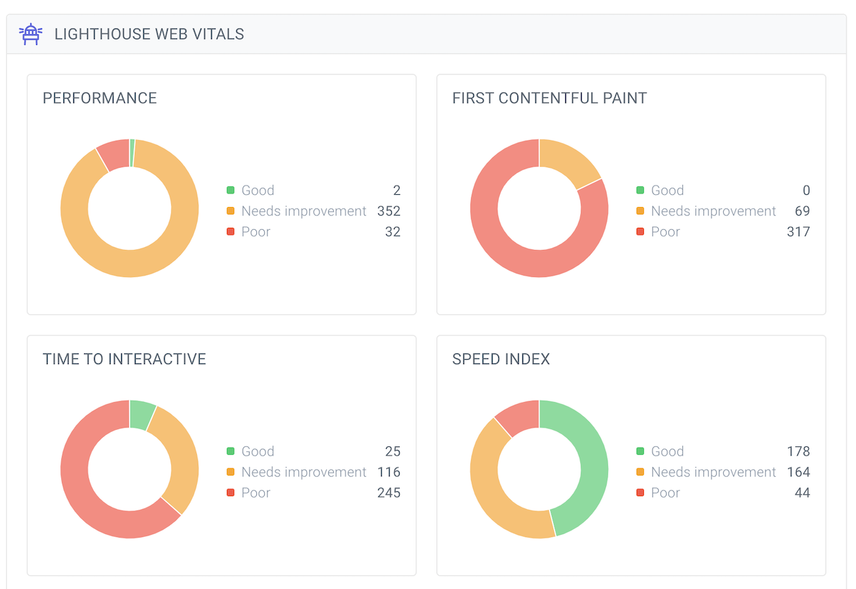
Using the Pages' Graph view you can easily see your overall performance:
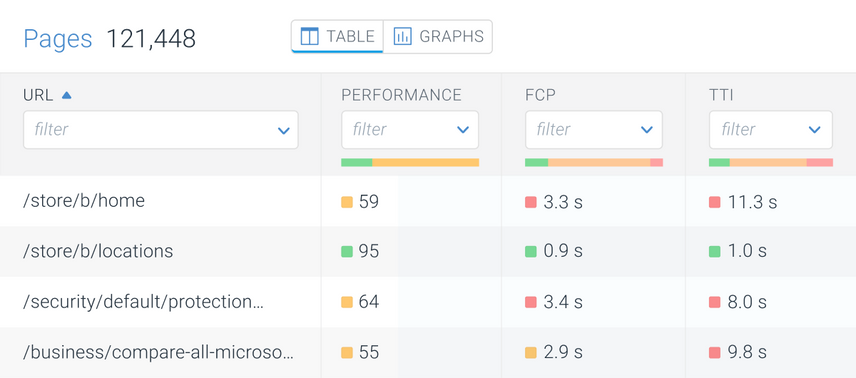
You can filter and sort on the Lighthouse data in Pages' Table view:
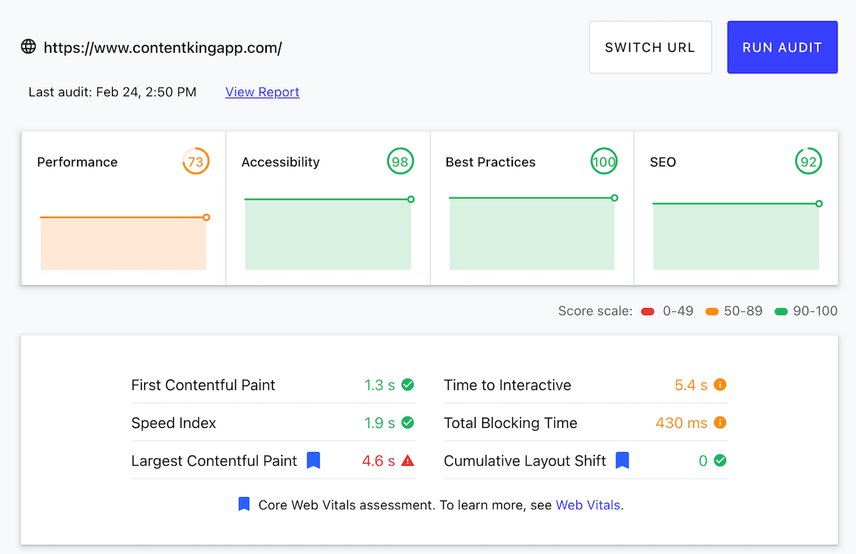
And of course, you can check out how individual pages are performing:
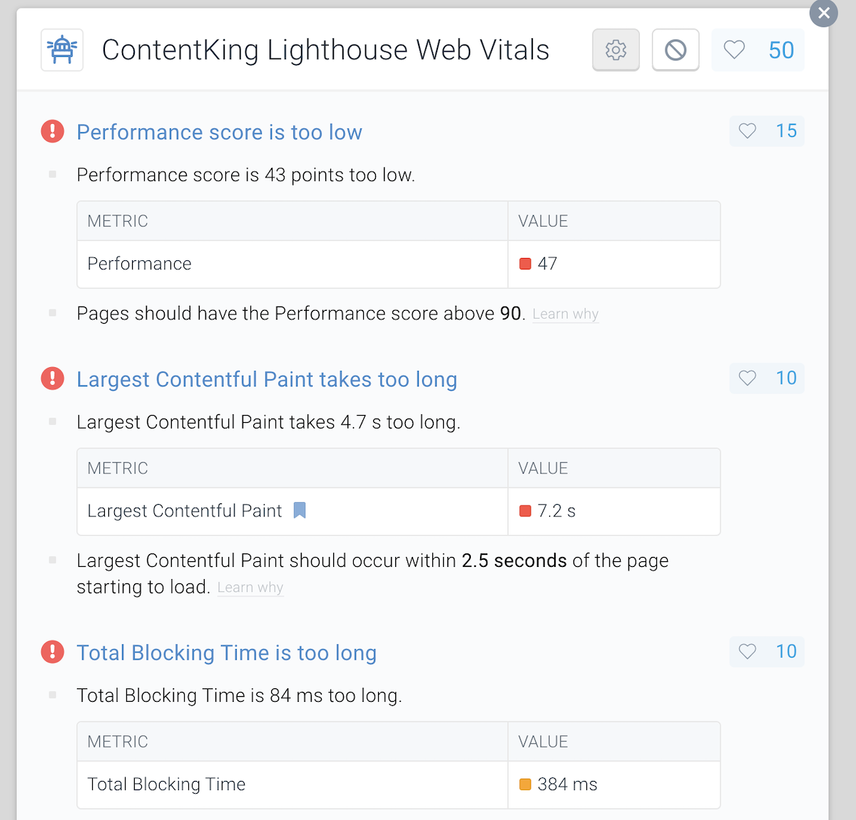
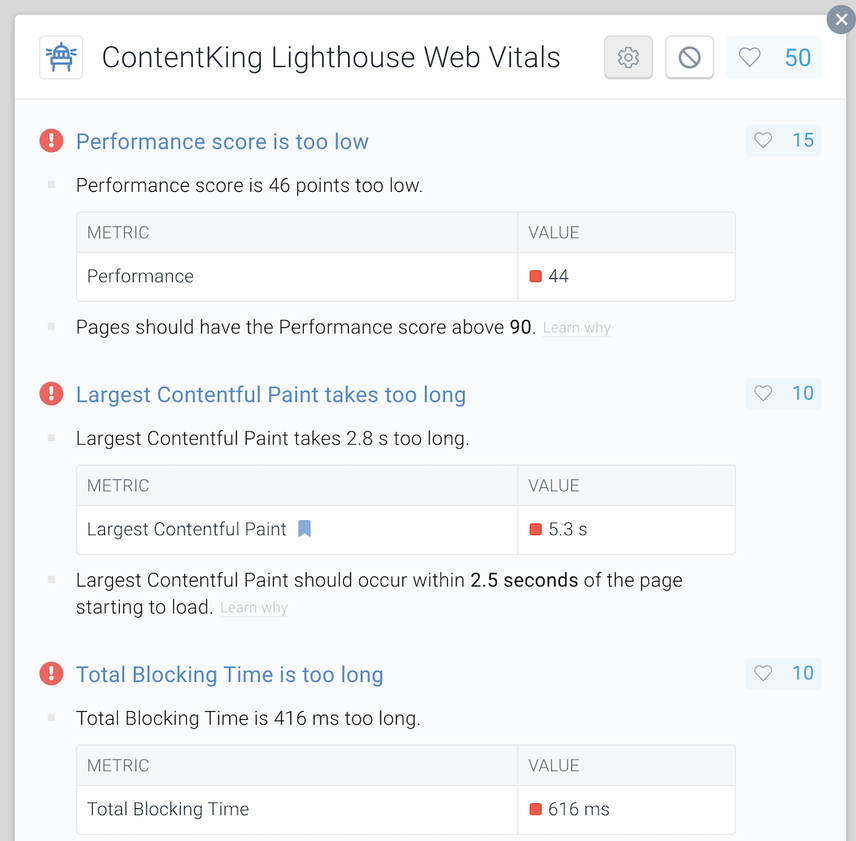
…what you need to improve:
…how the Lighthouse metrics change:
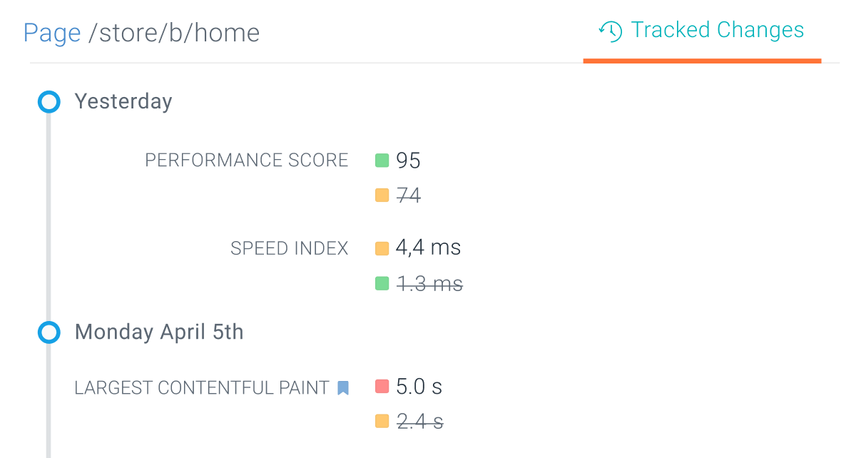
And last, but not least, ContentKing will also alert you in case your Lighthouse Web Vitals suddenly drop!

For those doing one-off checks and want to dig in using Chrome DevTools, there's the Performance tab that allows you to test and debug the Web Vitals metrics such as for example Largest Contentful Paint (LCP), Cumulative Layout Shift (CLS), First Paint (FP), First Contentful Paint (FCP) and or First Meaningful Paint (FMP).
When you turn on Screenshots and Web Vitals you see the different stages of your site evolving during rendering on a ticker.
PageSpeed Insights (PSI)
Google’s PageSpeed Insights tool (“PSI” for short) lets you submit a URLURL
The term URL is an acronym for the designation "Uniform Resource Locator".
Learn more, and it will then do three things:
- Pull up field data
- Collect lab data by running Lighthouse .
- Suggest improvements under “Opportunities” and “Diagnostics.”
We submit our homepageHomepage
A homepage is a collection of HTML documents that can be called up as individual webpages via one URL on the web with a client such as a browser.
Learn more again, and this is the field data we get:
PageSpeed Insights shows you what data they have for your URL. You may see that some metrics aren't available, those will be greyed out. This is an improvement, as in the early days the tool would hide all metrics if at least one of them wasn't available.
Below the URL-specific field data, we can choose whether to display the “Origin Summary” (the aggregate user experience of all pages served from our site):
Note that the Origin Summary paints a different picture of our performance. Our side-wide performance is lower than the homepage’s performance, meaning that pages other than the homepage are dragging our overall performance down.
If you scroll down a bit more, you’ll see the Lab Data:
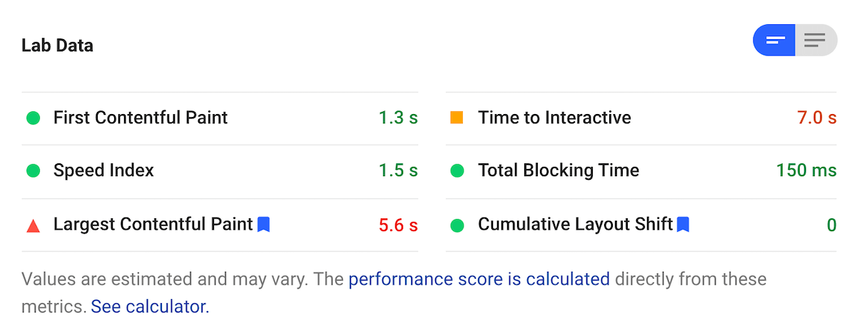
If you compare our lab data results from PageSpeed Insights vs. Lighthouse, you’ll find they are different. Even though we’re testing using the same settings, we’re not:
- In the same location (our physical location versus the location used by PSI).
- Running the same hardware (a 2018 MacBook versus PSI’s setup ).
- Using the same network connection (WiFi vs PSI’s setup ).
web.dev Measure
web.dev Measure is an alternative to PageSpeed Insights. Submit a URL, and Measure will report its Web Vitals based on lab data gathered using Lighthouse, in an interface that’s slightly easier to navigate. This is what it reports for our homepage:
As expected, we’re again seeing different reported metrics—even though the same tests were performed using the same settings. Again, this comes down to the fact that you can’t reliably create the exact same conditions when running Lighthouse from a different location, on different hardware, on a different network connection.
Google Search Console
Google Search Console provides field data for both desktop and mobile devices for all your verified properties. When you head over to Enhancements > Core Web Vitals, you’ll find the following screen:
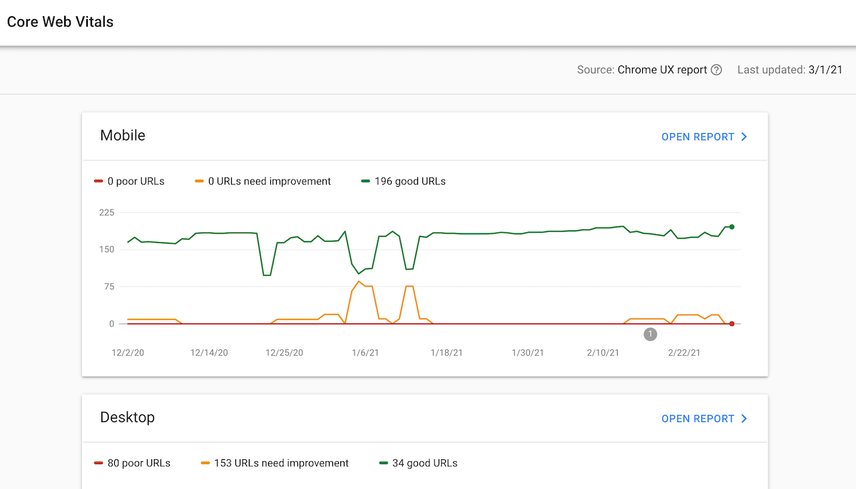
When you click on Open report for either Mobile or Desktop, this displays a more detailed view of your Core Web Vitals performance for that device type. If we click Mobile, this is what we see:
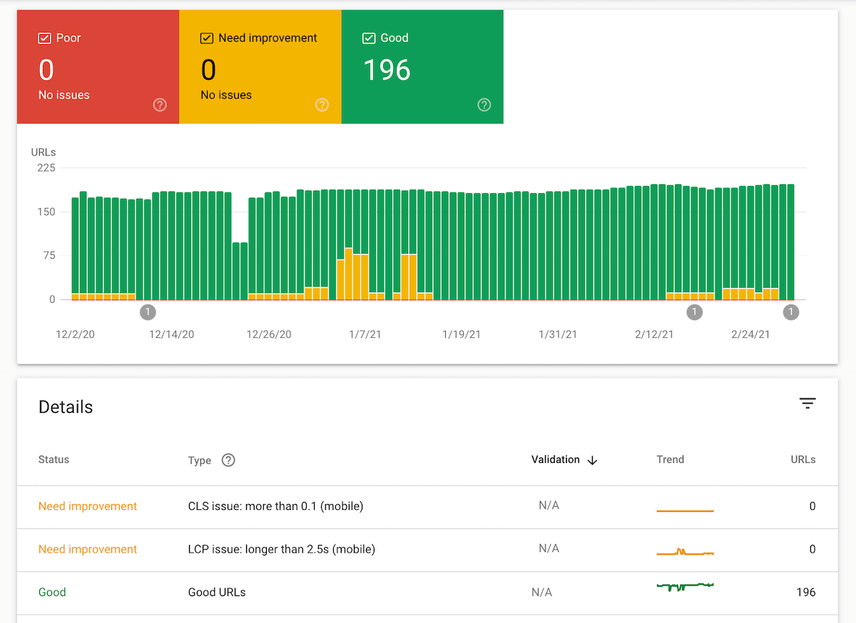
Looks like we’re doing pretty good!
Click any of the rows in the Details table to reach an overview with example URLs. URLs that Google deems to be similar are grouped together. For our site for example, some of the different templates are grouped together. It makes sense for Google to group these URLs, as they often suffer from the same issues holding back page load performance.
Summary of what data is offered by which tools
Field data | Lab data | |
|---|---|---|
ContentKing | (both device types) | (both device types) |
PageSpeed Insights | (both device types) | (both device types) |
web.dev Measure | (mobile only) | |
Google Search Console | (both device types) |

When you know that Google evaluates the performance of all of your site's pages (even non-indexable pages), it can feel overwhelming. That's why opitimizing your site's Core Web Vitals requires a smart approach.
Start with side-wide elements that cause issues (e.g. icons in the navigation causing layout shifts). Then you'll need to think of templates: Homepage, Category pages, Service pages, Product pages, Blogs, etc. They will all have common issues. So by fixing a template, you improve all pages that use this template.
Also, once the optimization is done, it's a good idea to create a process for adding new elements/content blocks on the website so that they won't hurt performance. A good example is adding Tweets via screenshots vs embeds: one of my experiments showed a difference of 11.5 seconds vs 1.9 seconds in unused JavaScript from just one embedded tweet that I replaced with a screenshot. Such processes will help make core web vitals optimization future proof.
How is your Lighthouse performance score calculated?
We’ve covered the Web Vitals scores in great detail, but we have yet to touch on how the overall Lighthouse performance score is calculated. First of all, the Lighthouse performance score is based on lab data. It’s a value on a scale from 4 (very bad) to 100 (amazing). It’s a weighted average of the Web Vitals’ metric scores, and the scores aren’t all weighted the same.
The weights for the current version —version 8— and the previous version 6/7 are as follows:
Lighthouse v8 | Lighthouse v6/7 | |
|---|---|---|
Largest Contentful Paint* | 25% | 25% |
Total Blocking Time | 30% | 25% |
First Contentful Paint | 10% | 15% |
Speed Index | 10% | 15% |
Time to Interactive | 10% | 15% |
Cumulative Layout Shift* | 15% | 5% |
Note: vitals with a * are Core Web Vitals
Important notes:
- The performance score you’ll find in Lighthouse, and other tools that rely on Lighthouse data, is always based on lab data.
- In the table above, only two Core Web Vitals metrics are shown. That’s because the third one, First Input Delay, isn’t measurable in a lab environment.
The Web Vitals metrics scores are calculated based on their performance relative to real websiteWebsite
A website is a collection of HTML documents that can be called up as individual webpages via one URL on the web with a client such as a browser.
Learn more performance data from the HTTP Archive .
For example: a Largest Contentful Paint (LCP) metric value of 1,220 ms is mapped to a metric score of 99 based on HTTP Archive data.
Lighthouse then uses the following color-coded ranges to “judge” your score:
- Red (poor):
0to49 - Orange (needs improvement): from
50to89 - Green (good): from
90to100
We highly recommend playing around with the Lighthouse Scoring Calculator , which immediately updates the score when you change the metrics. To save time configuring the calculator, plug in a URL in PageSpeed Insights and click the See calculator link beneath the table with the lab data:
Don’t forget that in order to pass the Core Web Vitals assessment, your page needs to show you’re scoring in the green for all three Core Web Vitals:
- Largest Contentful Paint (LCP)
- First Input Delay (FID)
- Cumulative Layout Shift (CLS)
The future of Core Web Vitals
We’ve covered what the Core Web Vitals are right now, but what does the future hold for us? We’re likely to see a lot of changes over the next few years, as Google will continue to tweak them.
Here’s what we know so far:
- The Core Web Vital set will grow over time: while Google wants to keep the amount of Core Web Vitals as low as possible, and the Web Vitals as easy to understand and measure as possible, it’s likely the set will grow over time. First Contentful Paint (FCP) is a prime candidate to be added for example; see the Chrome Dev Summit recording from Feb 12 2021 and the “Exploring the future of Core Web Vitals recording ” from Dec 14 2020.
- Increased weight of Cumulative Layout Shift (CLS) and tweaks: the weight of CLS is likely to be increased , and they’re looking to improve the handling of long-lived pages , as layout shifts now continue to be added to the CLS score after interaction.
- Support for measuring animation performance: user experience goes beyond initial page load, so Google’s looking into adding metrics that measure animation performance.
- First Input Delay (FID) could become stricter: lowering the FID time to 50-75ms could measure the user experience more accurately .
- Better support for Single Page Applications (SPAs): when using SPAs, the app transitions do not have performance metrics because they don’t have unique URLs. For example, First Input Delay (FID) and Largest Contentful Paint (LCP) are only measured upon initial load, but the Cumulative Layout Shift keeps increasing with every interaction. Therefore, Google is looking into ways to better measure Web Vitals in SPAs.
We additionally expect that:
- Core Web Vitals are a moving target: right now, the Moto G4 on a fast 3G connection is leading in determining your page’s Core Web Vitals, but as new, more advanced phones are developed and become available, and faster internet connections become the default, we expect Google will default to those.
- Websites may start considering blocking traffic from non-target markets: websites that get a lot of traffic from non-target markets that don’t have access to fast hardware and internet connections could consider preventing users from within these markets from accessing the website, thereby preventing a possible negative effect on their Core Web Vital scores.
Disclaimer: we recommend against doing this, as this leads to a poor user experience.
Frequently Asked Questions about Core Web Vitals
1. How big of an SEO impact do Core Web Vitals have?
Google has said that Core Web Vitals will likely only have a small impact, but we expect Core Web Vitals to become a more important ranking factor in the future. The reason? Everyone loves sites that provide a good user experience. And the Core Web Vitals metrics aim to measure that user experience.
Additionally, searchers are probably less likely to click back to the SERP if you’re providing a good user experience. This behavior is fed back into Google’s algorithm and will positively affect your page’s SEO performance.
2. How do I pass the Core Web Vitals assessment?
You’ll pass the Core Web Vitals assessment if you score green (“good”) for all three Core Web Vitals: Largest Contentful Paint, First Input Delay and Cumulative Layout Shift, as based on real user data, called “field data”.
3. Why are lab data and field data scores so different?
Lab data is collected in a simulated environment that aims to reliably run the same tests, using the same settings, whereas field data is collected from real user behaviour using different devices, with different internet connections, from different locations.
4. Why is there no field data for my URL or Origin Summary?
For individual URLs, you may see the “Field Data — The Chrome User Experience Report does not have sufficient real-world speed data for this page” notice, and for Origin Summary, “The Chrome User Experience Report does not have sufficient real-world speed data for this origin.” These mean there is not enough CrUX data available to generate a representative anonymized view of your performance.
Simply put, in order for the CrUX data to become available, you need to get more visitors onto your site! It’s likely you’ll then gain access to the Origin Summary first, because that’s an aggregate across all your pages.
5. Do non-indexable pages impact my Core Web Vitals?
It’s possible that pages that aren’t accessible and/or indexable for search engines do influence your Core Web Vitals scores. When asked in February 2021, Google’s John Mueller said they may have an impact.