> ## Documentation Index
> Fetch the complete documentation index at: https://www.conductor.com/docs/llms.txt
> Use this file to discover all available pages before exploring further.
# Locations
> Compare location-specific rank and market-share data side by side to spot regional discrepancies and build shareable views in Workspaces.
To support your research into location-specific organic performance, the Locations report aggregates and displays location-based rank data for an account. Quickly discover discrepancies in rank across location, review and compare location-specific market share movement, and easily add visually compelling views to Workspaces you can share with executive-level stakeholders.
Then, dig into the underlying data and jump to other supporting reports throughout Conductor.
**Performance** > **Traditional Search** > **More** > [**Locations**](https://app.conductor.com/u/locations)
## Overview
### Determine the keywords you want to focus on
There are a number of ways you can drill down to focus on only those keywords you're interested in:
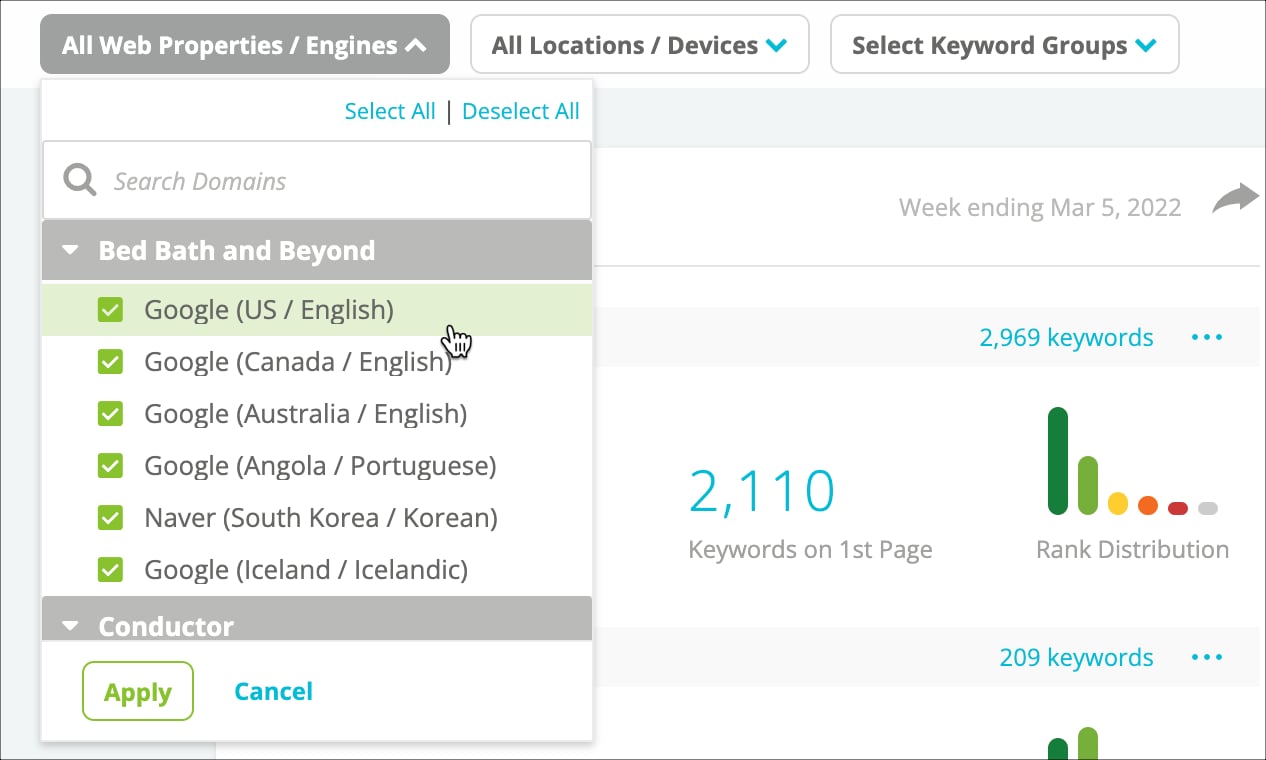
Select the web property or properties and search engine contexts you want to include in the report.\\
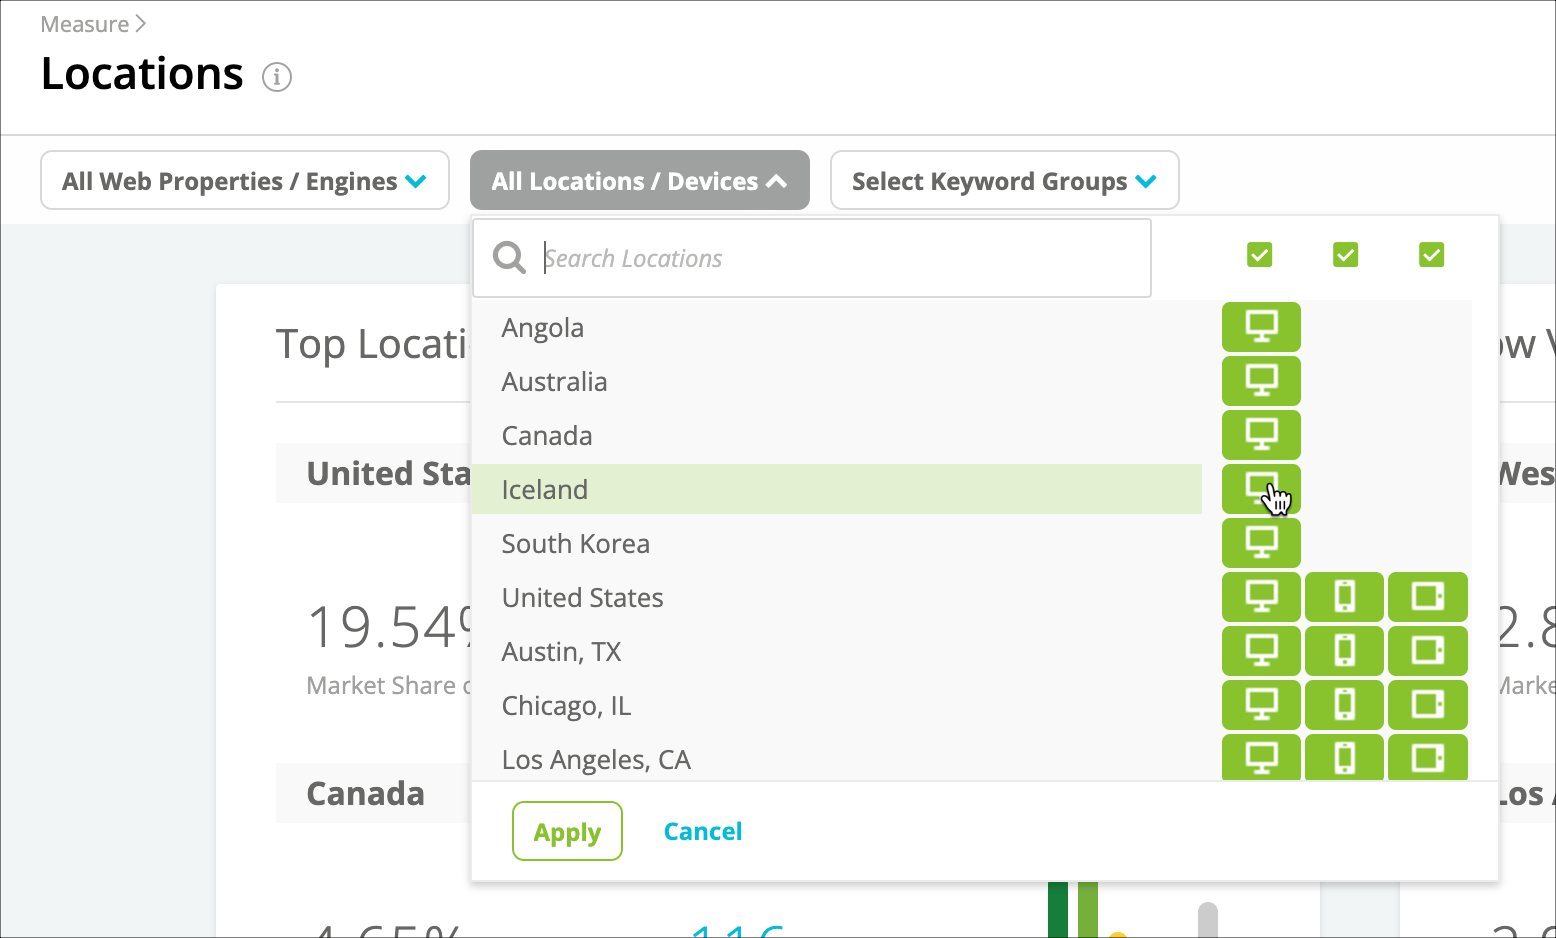
 Select the **locations** and **device-types** you want to see data for.\\
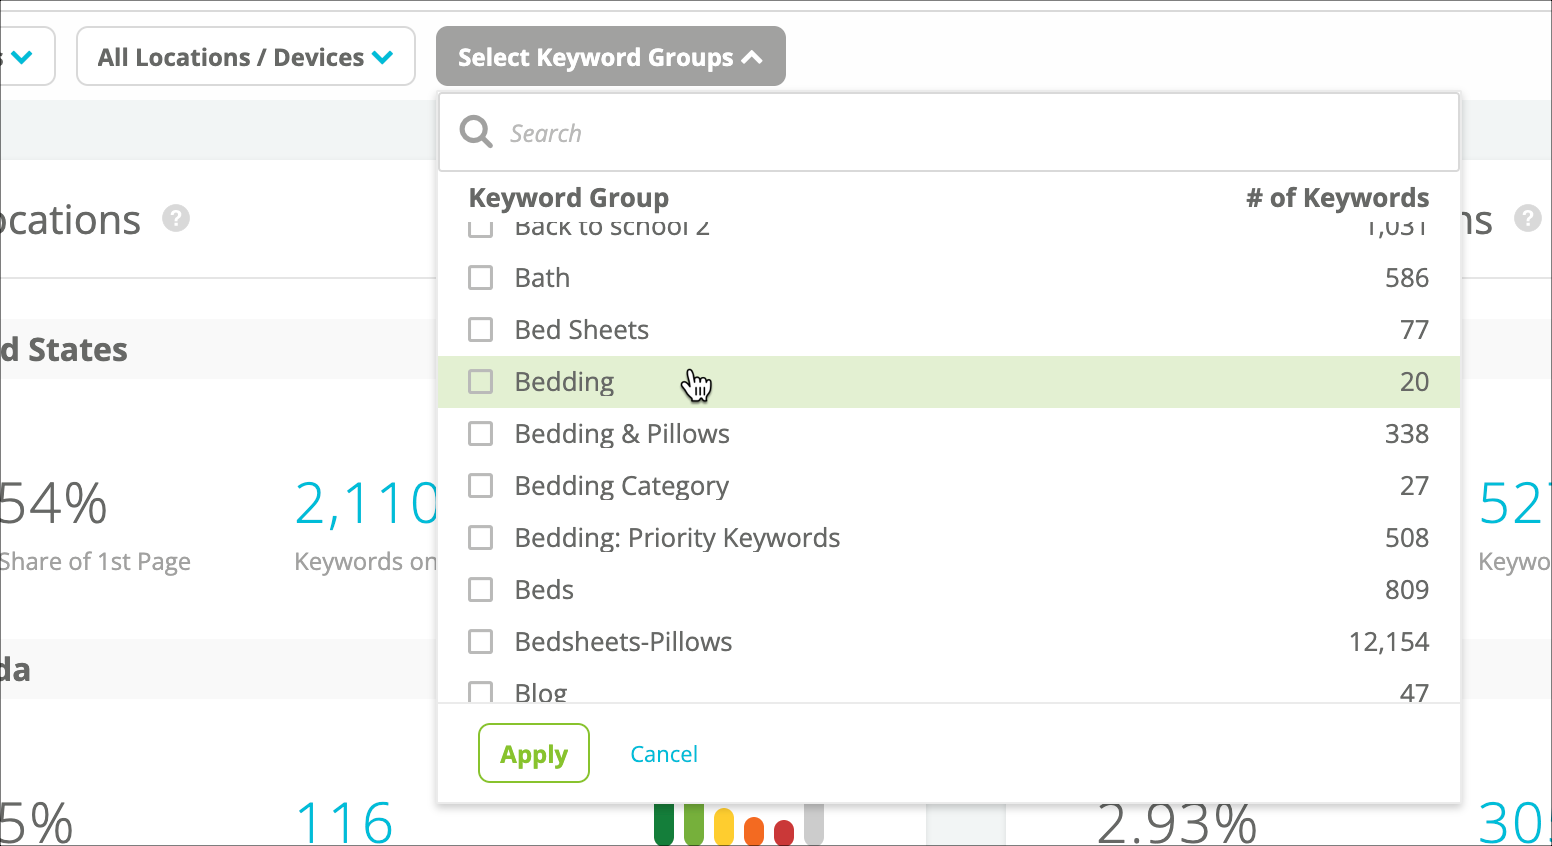
 Select the **keyword groups** you want to analyze. Use the search bar if you have a lot of keyword groups:\\
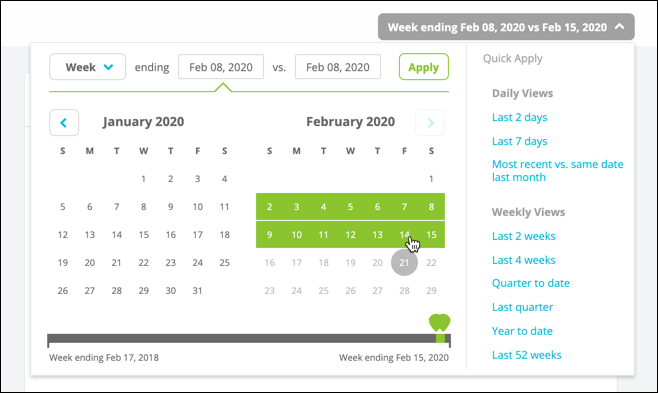
 Choose the **date range** you want to see results for:\\
 ### Review the data in the report
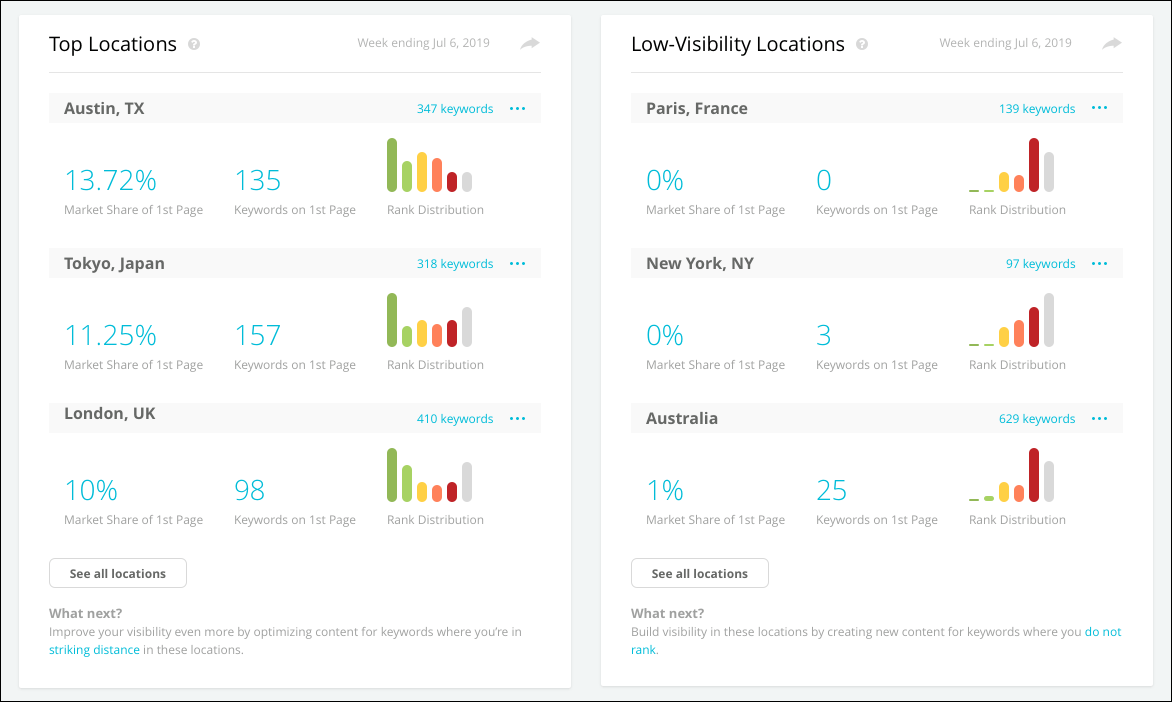
The **Top Locations** widget and the **Low-Visibility Locations** widget show the following metrics for your top-performing locations and your lowest-visibility locations in clear, visually engaging summaries:
* **Your Market Share of Top 10**: The percentage of results in the top ten search engine results that your content owns in this location. Note that this represents weighted market share data—we'll take into account the relevant keywords' monthly search volume. If the pages have no monthly search volume (or have values of "N/A"), then the market share will appear as 0%.
* **Keywords in Top 10**: The number of keywords for which your content has results on the first page of search engine results in this location.
* **Rank Distribution**: Your ownership of results for your tracked keywords between visibility zones in this location.
### Review the data in the report
The **Top Locations** widget and the **Low-Visibility Locations** widget show the following metrics for your top-performing locations and your lowest-visibility locations in clear, visually engaging summaries:
* **Your Market Share of Top 10**: The percentage of results in the top ten search engine results that your content owns in this location. Note that this represents weighted market share data—we'll take into account the relevant keywords' monthly search volume. If the pages have no monthly search volume (or have values of "N/A"), then the market share will appear as 0%.
* **Keywords in Top 10**: The number of keywords for which your content has results on the first page of search engine results in this location.
* **Rank Distribution**: Your ownership of results for your tracked keywords between visibility zones in this location.
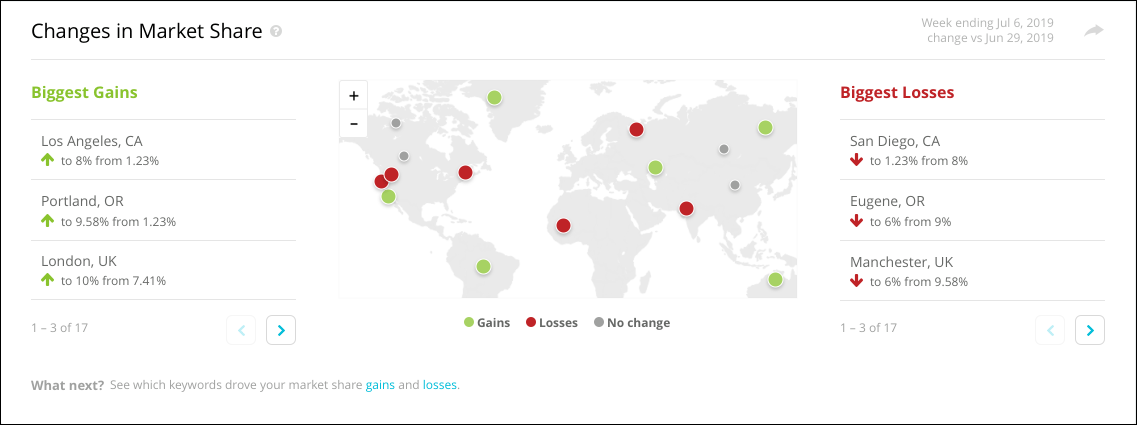
 The **Changes in Market Share** widget shows your biggest gains and losses in market share plotted across a map of your tracked locations. Note that this represents weighted market share data—we'll take into account the relevant keywords' monthly search volume. If the pages have no monthly search volume (or have values of "N/A"), then the market share will appear as 0%.\\
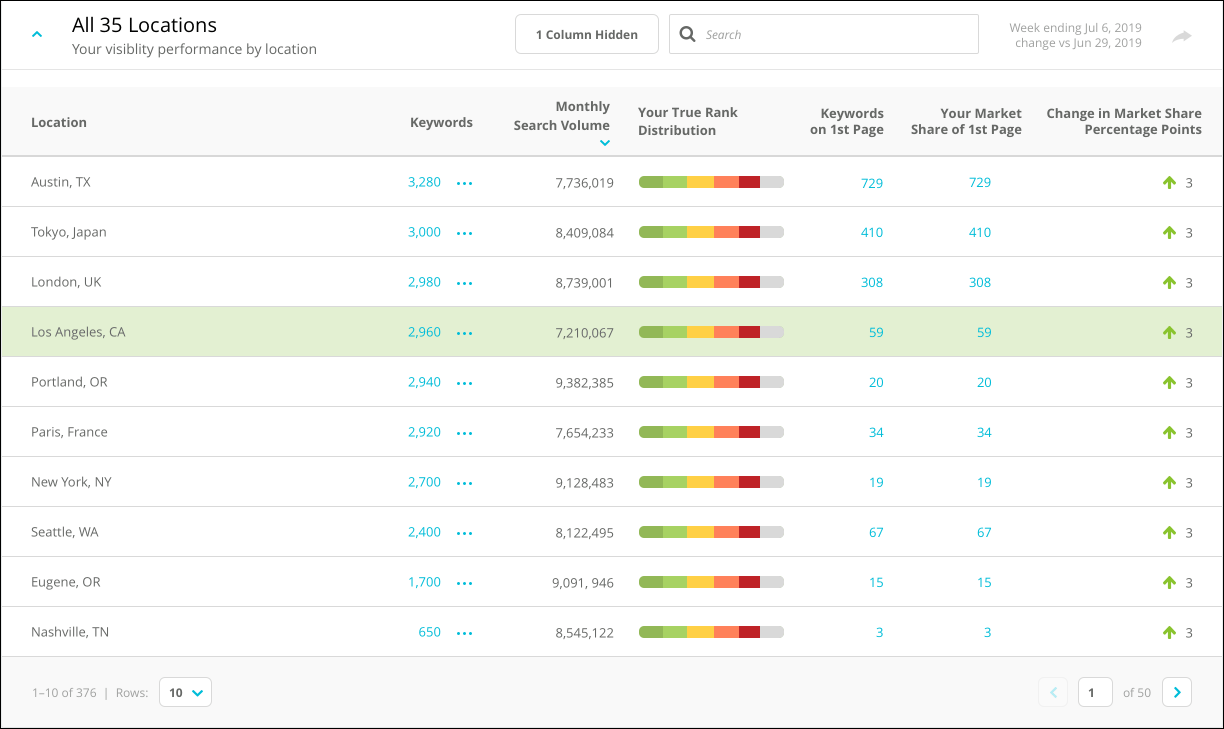
 The **All Locations** section reveals a table of all your locations, where you can see each compared across the following metrics:
* **Keywords**: The number of keywords you are tracking for the location.
* **Monthly Search Volume**: The monthly search volume collectively for all the keywords you are tracking for the location.
* **Your** **True Rank** **Distribution**: Your ownership of results for your tracked keywords across visibility zones in this location.
* **Keywords in Top 10**: The number of keywords for which your content has results in the top 10 search engine results in this location.
* **Change in Keywords in Top 10**: The change across the reporting period in the number of keywords for which your content has results in the top 10 search engine results in this location.
* **Your Market Share of Top 10**: The percentage of results in the top ten search engine results that your content owns in this location. Note that this represents weighted market share data—we'll take into account the relevant keywords' monthly search volume. If the pages have no monthly search volume (or have values of "N/A"), then the market share will appear as 0%.
* **Change in Market Share of Top 10**: The change across the reporting period in the percentage of results you own in this location in the top 10 search engine results. Note that this represents weighted market share data—we'll take into account the relevant keywords' monthly search volume. If the pages have no monthly search volume (or have values of "N/A"), then the market share will appear as 0%.
The **All Locations** section reveals a table of all your locations, where you can see each compared across the following metrics:
* **Keywords**: The number of keywords you are tracking for the location.
* **Monthly Search Volume**: The monthly search volume collectively for all the keywords you are tracking for the location.
* **Your** **True Rank** **Distribution**: Your ownership of results for your tracked keywords across visibility zones in this location.
* **Keywords in Top 10**: The number of keywords for which your content has results in the top 10 search engine results in this location.
* **Change in Keywords in Top 10**: The change across the reporting period in the number of keywords for which your content has results in the top 10 search engine results in this location.
* **Your Market Share of Top 10**: The percentage of results in the top ten search engine results that your content owns in this location. Note that this represents weighted market share data—we'll take into account the relevant keywords' monthly search volume. If the pages have no monthly search volume (or have values of "N/A"), then the market share will appear as 0%.
* **Change in Market Share of Top 10**: The change across the reporting period in the percentage of results you own in this location in the top 10 search engine results. Note that this represents weighted market share data—we'll take into account the relevant keywords' monthly search volume. If the pages have no monthly search volume (or have values of "N/A"), then the market share will appear as 0%.
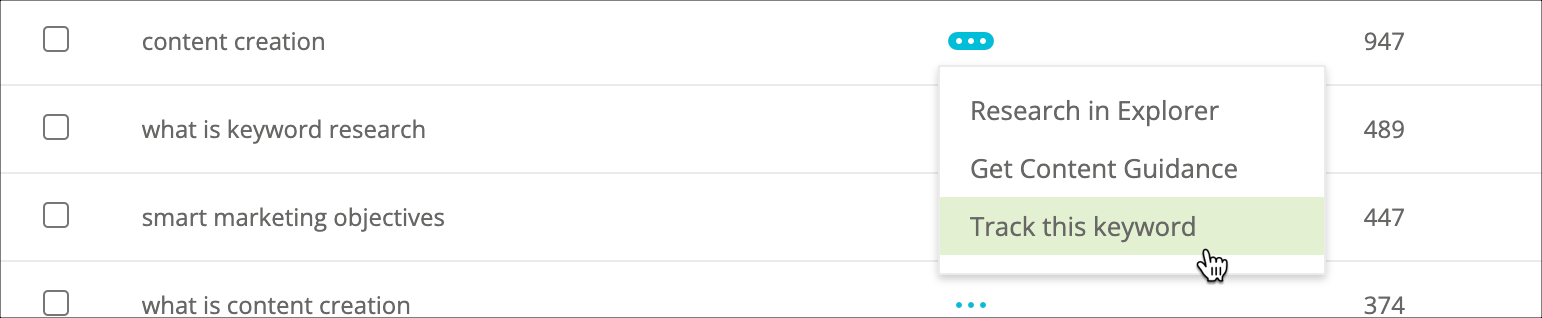
 Analyze the underlying data in any of this report's widgets:
Click the **three-dot menu** for a location. You can choose to jump to the [Keywords](/docs/intelligence/keywords/) report to review:
* The Striking Distance keywords your content ranks for at this location.
* The keywords your content does not rank for at this location.
Analyze the underlying data in any of this report's widgets:
Click the **three-dot menu** for a location. You can choose to jump to the [Keywords](/docs/intelligence/keywords/) report to review:
* The Striking Distance keywords your content ranks for at this location.
* The keywords your content does not rank for at this location.
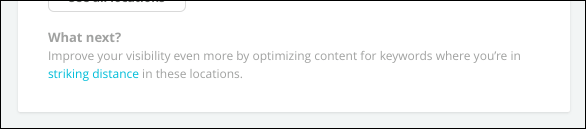
 Follow the links to other reports in Conductor in the **What next?** section of the **Top Locations** and **Low-Visibility Locations** widgets. These sections provide quick ideas for following up on the data that appears in the report.\\
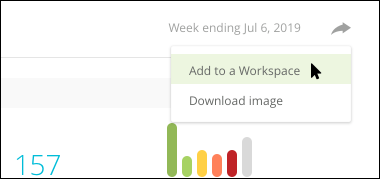
 Use the **Share** icon on a widget to [add it to a Workspace](/docs/platform/creating-and-maintaining-workspaces/#add-data-from-conductor-to-a-workspace) or [download an image](/docs/platform/general-conductor-faqs/#how-do-i-export-images-from-conductor) of it.\\
 ## Using Locations
* [Compare and monitor your performance against your competitors across your tracked locations](https://app.conductor.com/u/community?ms_url=%2Fdocuments%2F15dfcaf0-e275-4133-8093-efa6959fe47b)
## Using Locations
* [Compare and monitor your performance against your competitors across your tracked locations](https://app.conductor.com/u/community?ms_url=%2Fdocuments%2F15dfcaf0-e275-4133-8093-efa6959fe47b)