> ## Documentation Index
> Fetch the complete documentation index at: https://www.conductor.com/docs/llms.txt
> Use this file to discover all available pages before exploring further.
# Market Share
> See your Share of Voice across SERPs—how your domain stacks up against competitors for your tracked keywords.
The Market Share report gives you insight into your Share of Voice—how your content performs against your competitors for the top positions in search results. Learning about your market share can help you discover:
* How much real estate your content has earned on the first page of results compared to your competitors.
* New SEO competitors for your keywords that might not be your traditional business competitors.
* Backlinking opportunities from publishers and news outlets who rank well for a topic.
**Performance** > **Traditional Search** > [**Market Share**](https://app.conductor.com/u/market-share)
## Overview
### Determine what data appears in the report
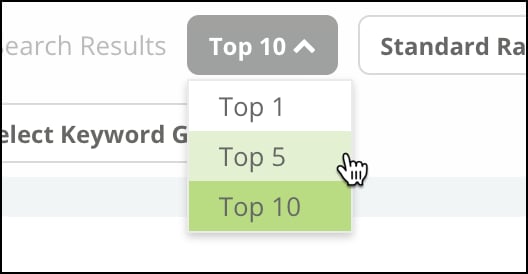
Select whether you want to see data from the following positions in the search results:
* **Top 1**
* **Top 5**
* **Top 10**
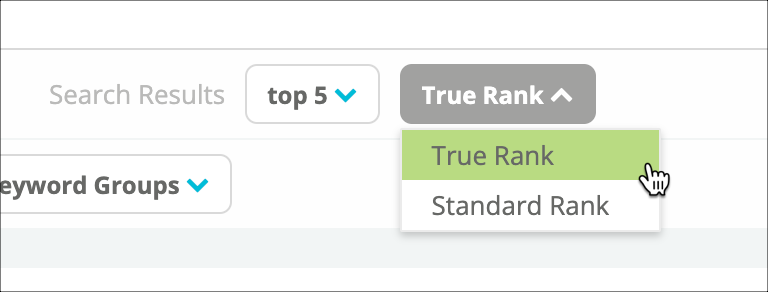
 Select whether you want to see keywords sorted by **True Rank** or **Standard Rank**.\\
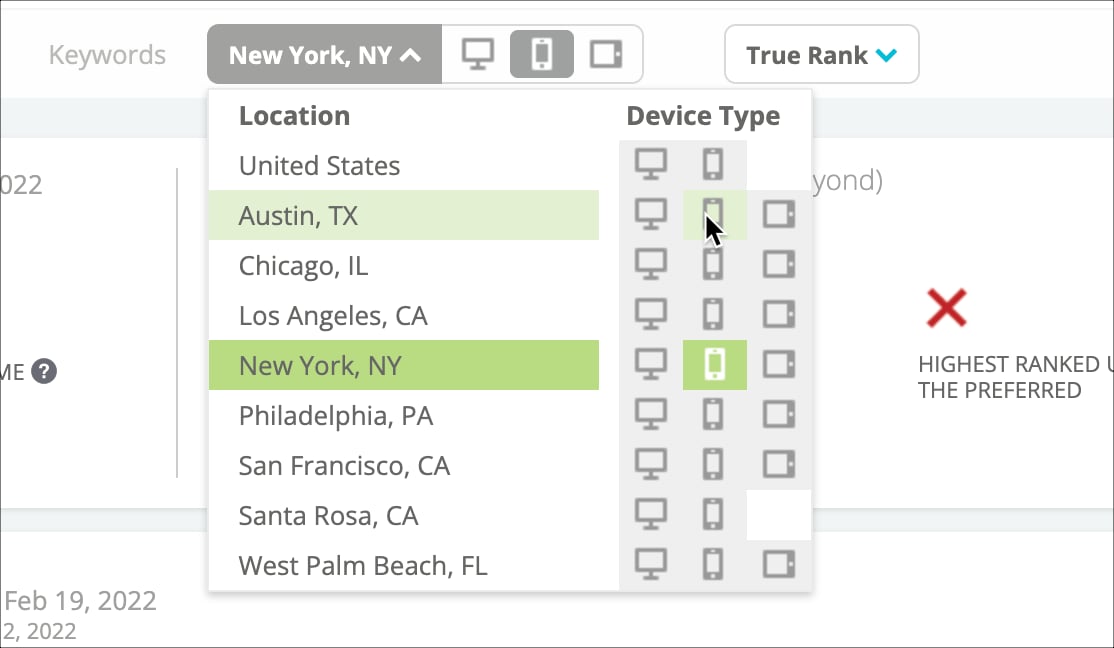
 Choose the **location** and **device** you want to see results for.\\
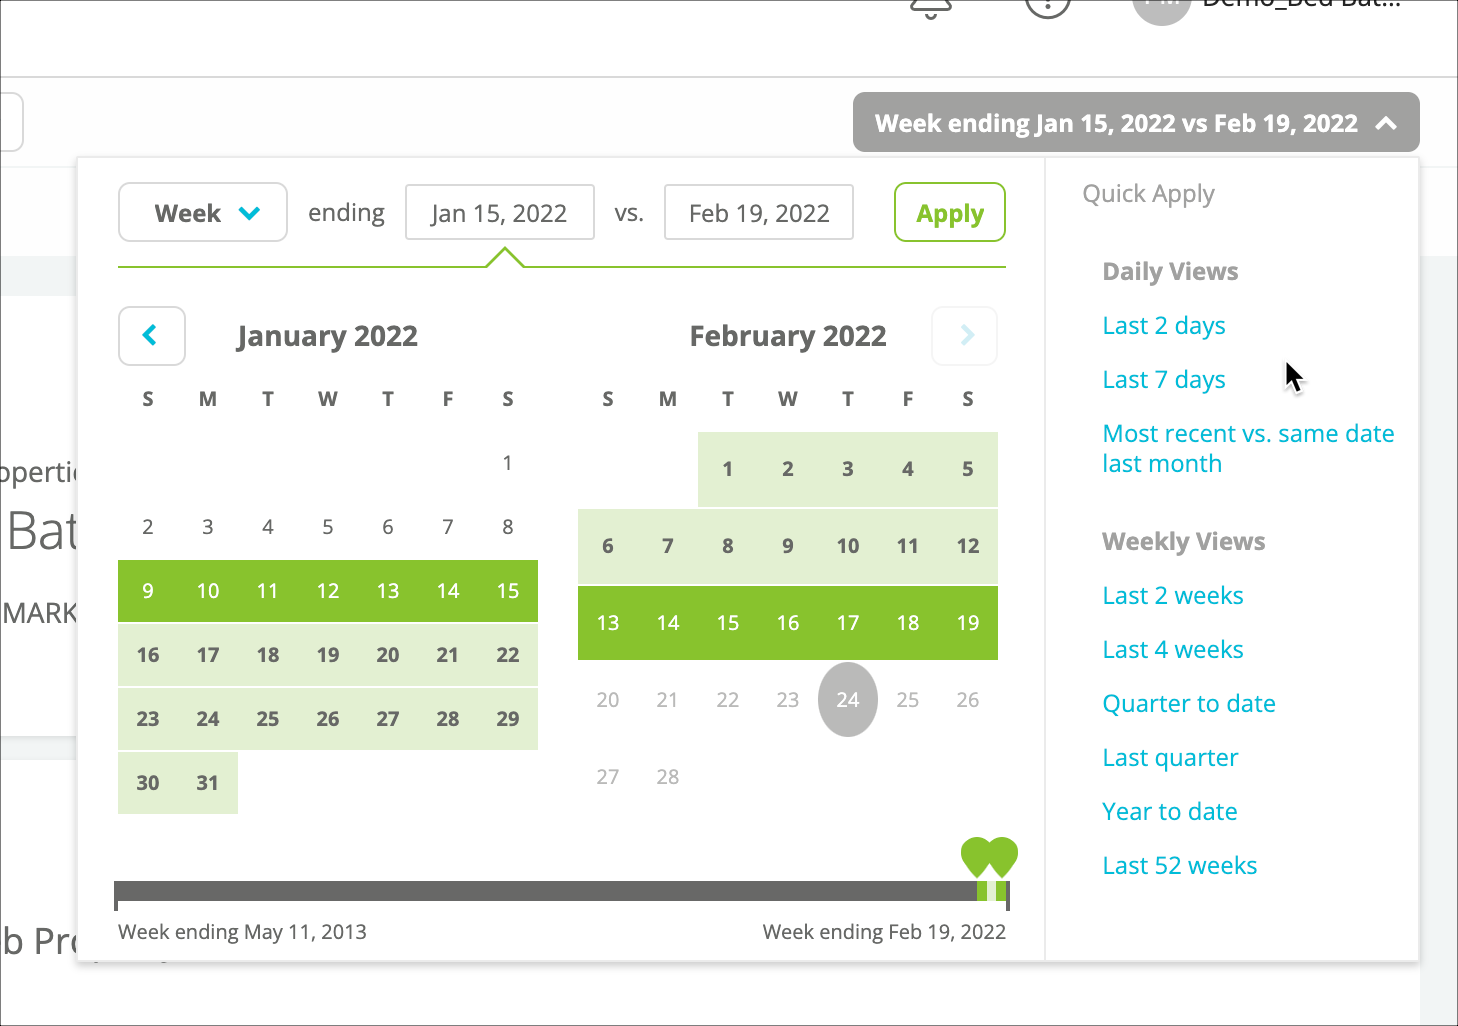
 Choose the date range you want to see results for.\\
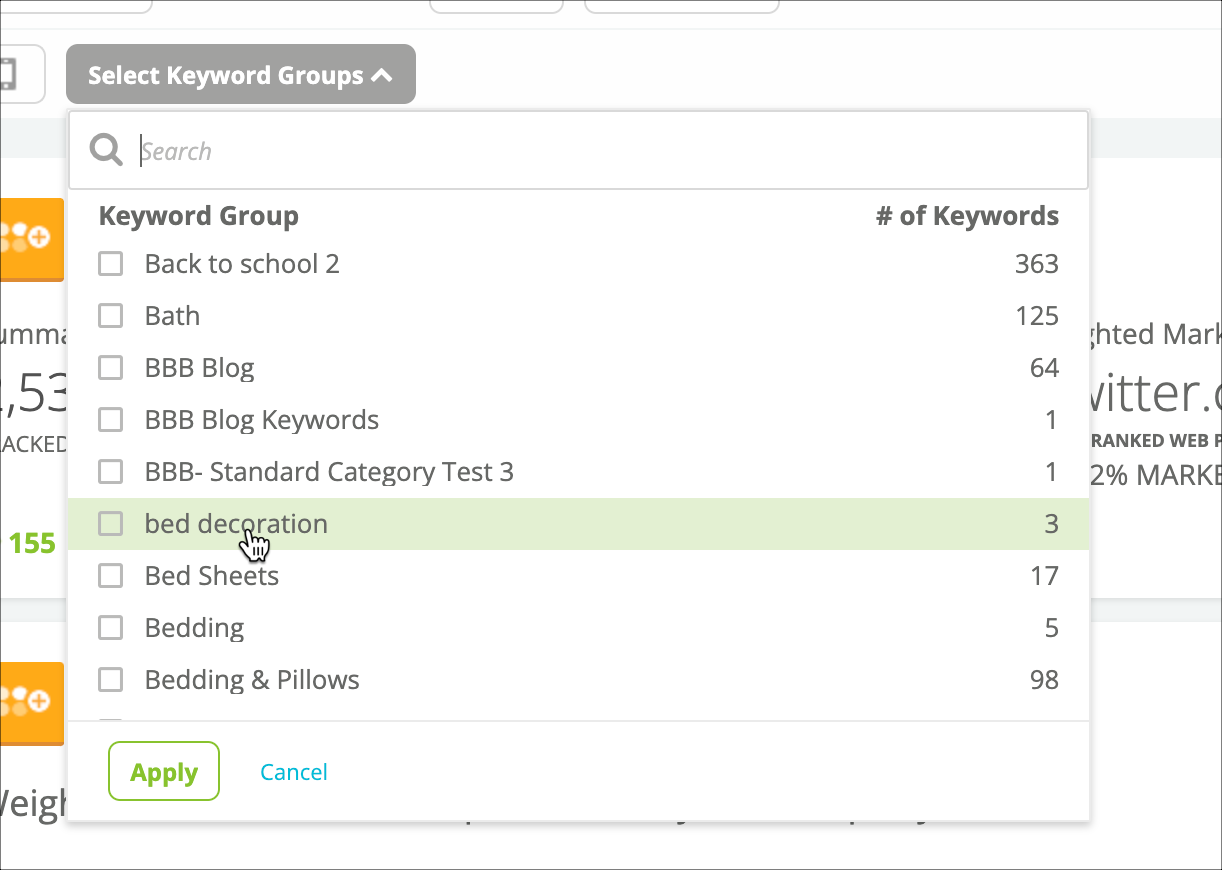
 Use the **Select** **Keyword** **Groups** filter to choose the specific keyword groups you want to analyze. Use the search bar if you have a lot of keyword groups. By default, the report shows data for all of your tracked keywords.\\
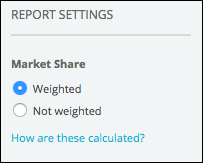
 In the **Report Settings** section on the left, choose to see [**Weighted** or **Not weighted**](/docs/intelligence/market-share-faqs/#what-is-the-difference-between-not-weighted-and-weighted-market-share) market share data. By default the report uses Weighted results.\\
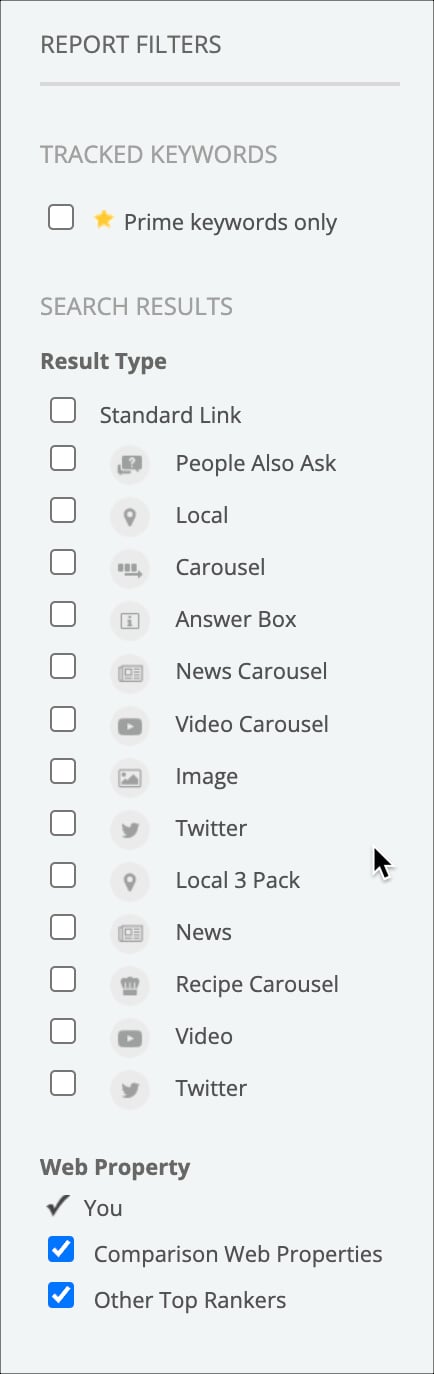
 In the **Report Filters** section on the left, select whether you want to see data for:
* **Prime** keywords only.
* Certain types of universal result types, which represent different types of content.
* [**Comparison Web Properties** or **Top Rankers**](/docs/platform/web-properties-faqs/#what-is-the-difference-between-a-top-ranker-and-competitor).
In the **Report Filters** section on the left, select whether you want to see data for:
* **Prime** keywords only.
* Certain types of universal result types, which represent different types of content.
* [**Comparison Web Properties** or **Top Rankers**](/docs/platform/web-properties-faqs/#what-is-the-difference-between-a-top-ranker-and-competitor).
 ### Review the data in the report
Data in this report reflects whose content appears in the top positions of results (top position, top five positions, or first page, depending on your choice in the filter at the top of the report).
The **Summary bar** includes high-level information based on filters you have applied to the report. You can review:
* The number of keywords you're reporting on.
* The total monthly search volume of those keywords.
* The web properties with the largest market share.
### Review the data in the report
Data in this report reflects whose content appears in the top positions of results (top position, top five positions, or first page, depending on your choice in the filter at the top of the report).
The **Summary bar** includes high-level information based on filters you have applied to the report. You can review:
* The number of keywords you're reporting on.
* The total monthly search volume of those keywords.
* The web properties with the largest market share.
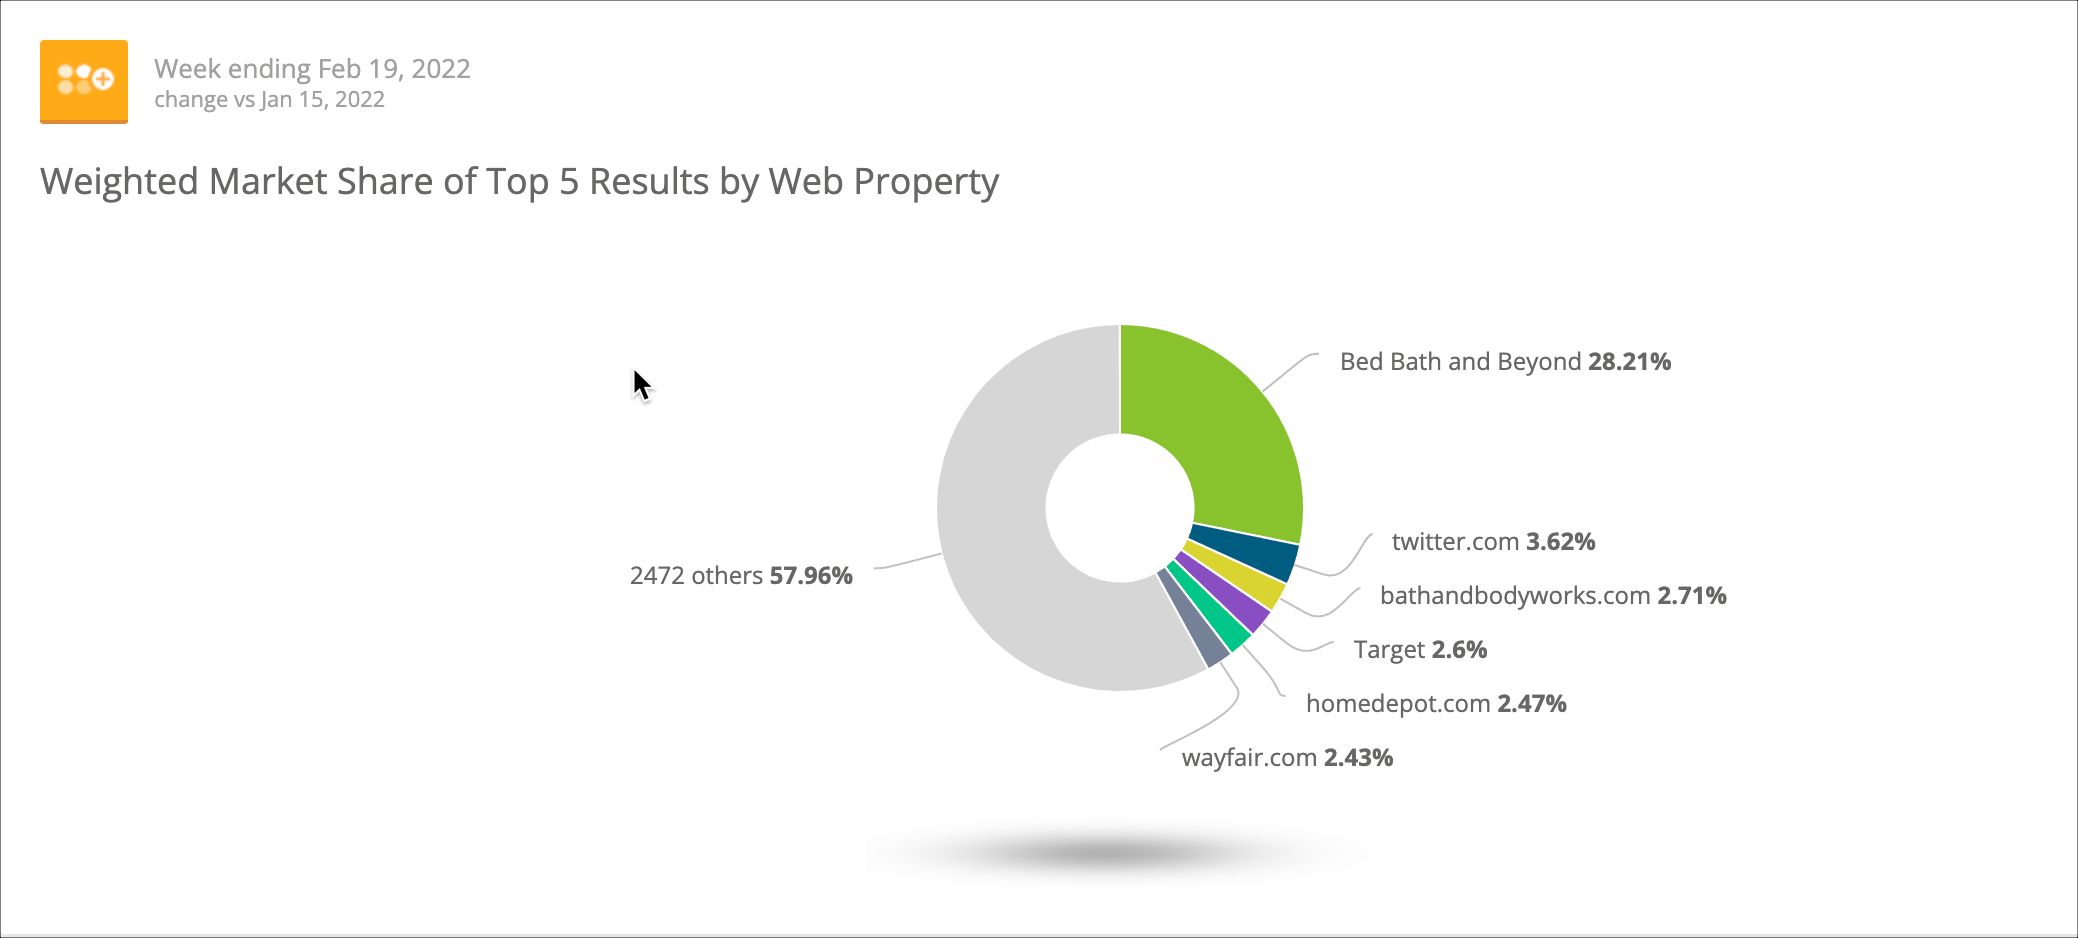
 The pie chart indicates the percentage of times a web property (such as a brand's domain) appeared in the top positions of a results page for the set of keywords you are reporting on.\\
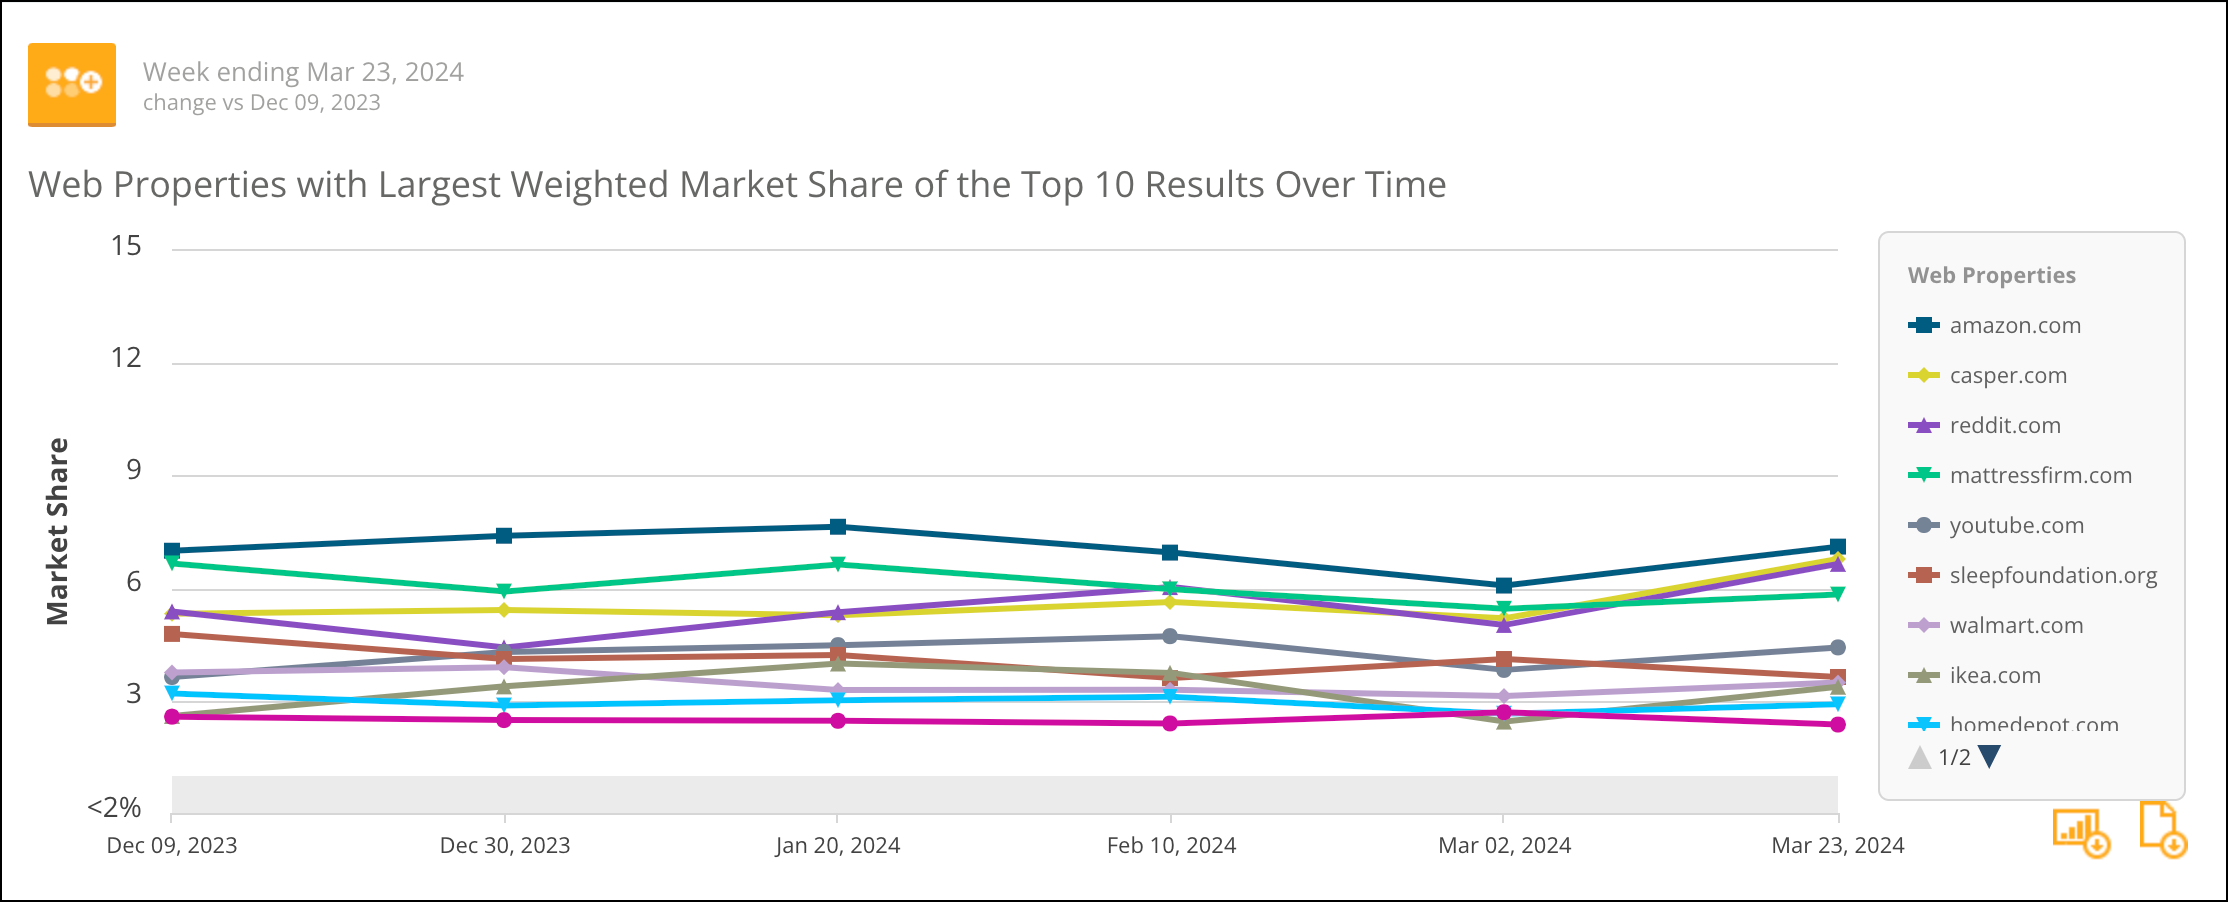
 The line graph shows a trended view of this market share data across the time period you are reporting on. To the right on the graph, you can select the web properties that appear in the graph.\\
 The table includes:
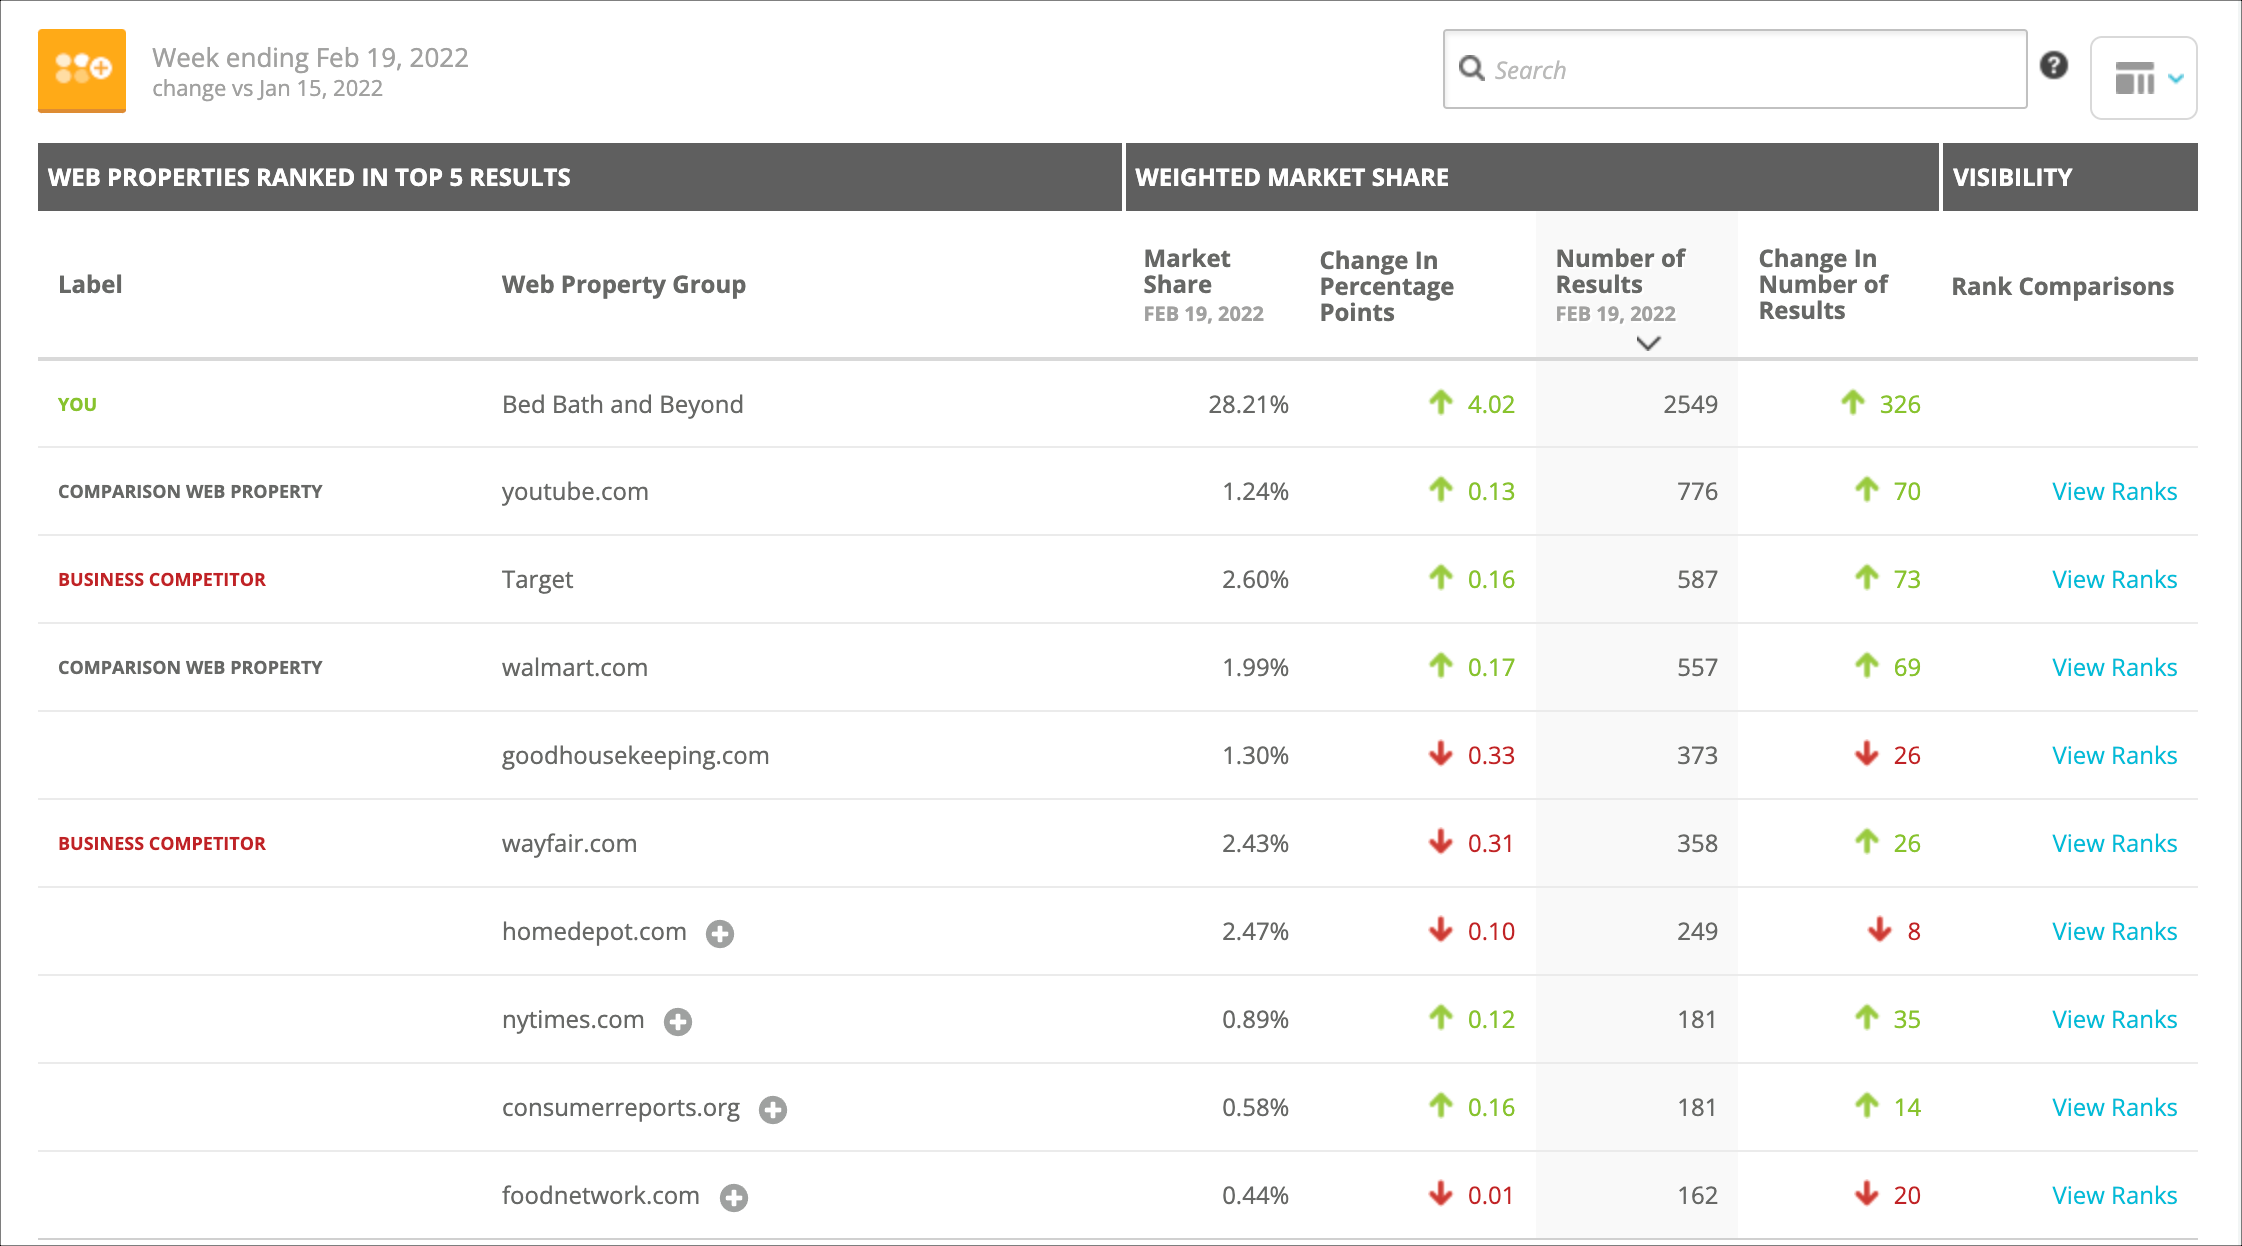
* Each web property that appears in the top positions. Note that data for subdomains are rolled-up under domains. For example, data for *[www.abc.com](http://www.abc.com)* and *shop.abc.com* would be included under the entry for abc.com.
* Market share data for each web property.
* A link to jump to the [Rank Comparisons](/docs/intelligence/rank-comparisons/) report to compare this content's search visibility with your own
The table includes:
* Each web property that appears in the top positions. Note that data for subdomains are rolled-up under domains. For example, data for *[www.abc.com](http://www.abc.com)* and *shop.abc.com* would be included under the entry for abc.com.
* Market share data for each web property.
* A link to jump to the [Rank Comparisons](/docs/intelligence/rank-comparisons/) report to compare this content's search visibility with your own
 ### Download data from Market Share
Want to export market share data to manipulate outside the Conductor platform?
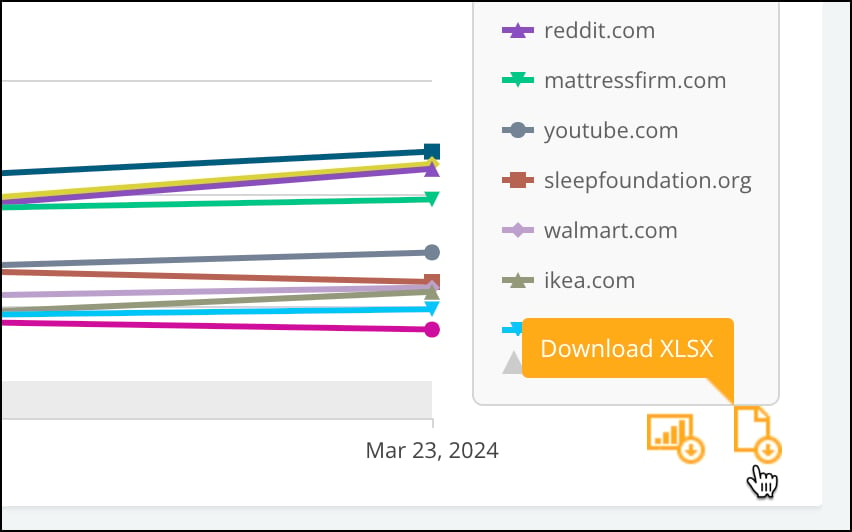
* You can export trended market share data for any domain that was in the top five by market share during your reporting time period. Just click the **Download XLSX** icon under the trend chart.\\
### Download data from Market Share
Want to export market share data to manipulate outside the Conductor platform?
* You can export trended market share data for any domain that was in the top five by market share during your reporting time period. Just click the **Download XLSX** icon under the trend chart.\\
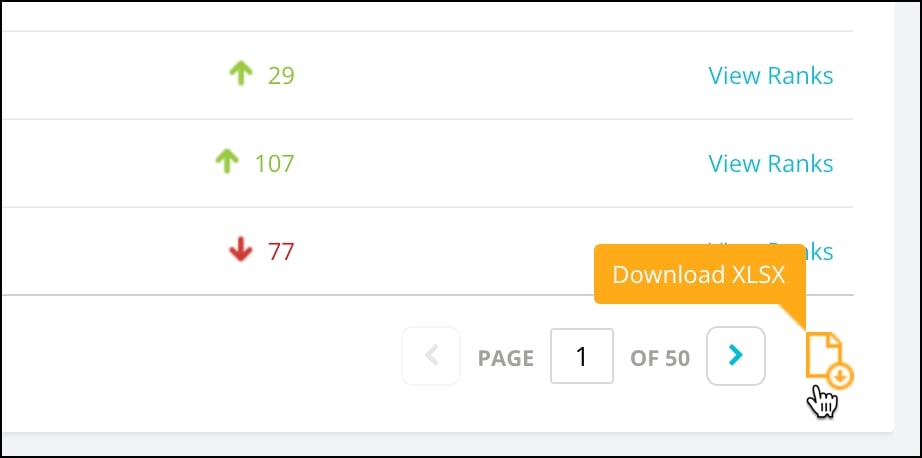
 * You can export your total market share data for your reporting time period by clicking the **Download XLSX** icon under the table.\\
 ## Using Market Share
* [Identify and track your top competitors with Market Share](https://app.conductor.com/u/community?ms_url=%2Fcourses%2Fdfe2877a-a1d6-474f-8e36-733be6e1fa8e%2Fstep%2Fa92dd5e4-9903-4a9c-a9b3-22b61f2cae45)
* [Improve your website's visibility with competitive insights](https://app.conductor.com/u/community?ms_url=%2Fcourses%2Fa02cd5ee-d82e-41e8-b6f5-8bbd04830723%2Fstep%2F9a51b563-83a0-455e-b5fa-261af4d8669d)
* [Building an executive report](https://app.conductor.com/u/community?ms_url=%2Fcourses%2Fcf5d38ef-6e33-4b47-84bd-1c2817f44b6b%2Fstep%2F248a95f8-49a9-4c6a-ac10-3d8be1aef9b1)
* [Create a standard workspace to use across departments](https://app.conductor.com/u/community?ms_url=%2Fdocuments%2Fa255b6ef-e1ba-4b7c-a9d5-2ae73c2bfa27)
* [Compare and monitor your performance against your competitors across your tracked locations](https://app.conductor.com/u/community?ms_url=%2Fdocuments%2F15dfcaf0-e275-4133-8093-efa6959fe47b)
* [Determine whether you were affected by a Google algorithm update](https://app.conductor.com/u/community?ms_url=%2Fdocuments%2Ffcef8ee5-fad1-460a-bd66-1829764ba48a)
## FAQs
[Review this feature's frequently asked questions](/docs/intelligence/market-share-faqs/)
## Using Market Share
* [Identify and track your top competitors with Market Share](https://app.conductor.com/u/community?ms_url=%2Fcourses%2Fdfe2877a-a1d6-474f-8e36-733be6e1fa8e%2Fstep%2Fa92dd5e4-9903-4a9c-a9b3-22b61f2cae45)
* [Improve your website's visibility with competitive insights](https://app.conductor.com/u/community?ms_url=%2Fcourses%2Fa02cd5ee-d82e-41e8-b6f5-8bbd04830723%2Fstep%2F9a51b563-83a0-455e-b5fa-261af4d8669d)
* [Building an executive report](https://app.conductor.com/u/community?ms_url=%2Fcourses%2Fcf5d38ef-6e33-4b47-84bd-1c2817f44b6b%2Fstep%2F248a95f8-49a9-4c6a-ac10-3d8be1aef9b1)
* [Create a standard workspace to use across departments](https://app.conductor.com/u/community?ms_url=%2Fdocuments%2Fa255b6ef-e1ba-4b7c-a9d5-2ae73c2bfa27)
* [Compare and monitor your performance against your competitors across your tracked locations](https://app.conductor.com/u/community?ms_url=%2Fdocuments%2F15dfcaf0-e275-4133-8093-efa6959fe47b)
* [Determine whether you were affected by a Google algorithm update](https://app.conductor.com/u/community?ms_url=%2Fdocuments%2Ffcef8ee5-fad1-460a-bd66-1829764ba48a)
## FAQs
[Review this feature's frequently asked questions](/docs/intelligence/market-share-faqs/)