> ## Documentation Index
> Fetch the complete documentation index at: https://www.conductor.com/docs/llms.txt
> Use this file to discover all available pages before exploring further.
# Page Groups
> Compare performance across page groups to review sections of your site (or campaigns) side by side.
The Page Groups report lets you view the performance of a page group—or compare the performance of multiple page groups to one another.
If you've integrated analytics, Conductor data reflects [only your top 10,000 pages (or 100,000 pages, if you have upgraded)](/docs/intelligence/web-analytics-faqs/#how-many-pages-from-my-site-does-conductor-report-through-my-integrated-web-analytics) with organic traffic each week. Remember, all data in this report reflects only organic traffic.
**Performance** > **Websites** > [**Page Groups**](https://app.conductor.com/u/page-groups)
## Overview
### Determine the Scope of the Report
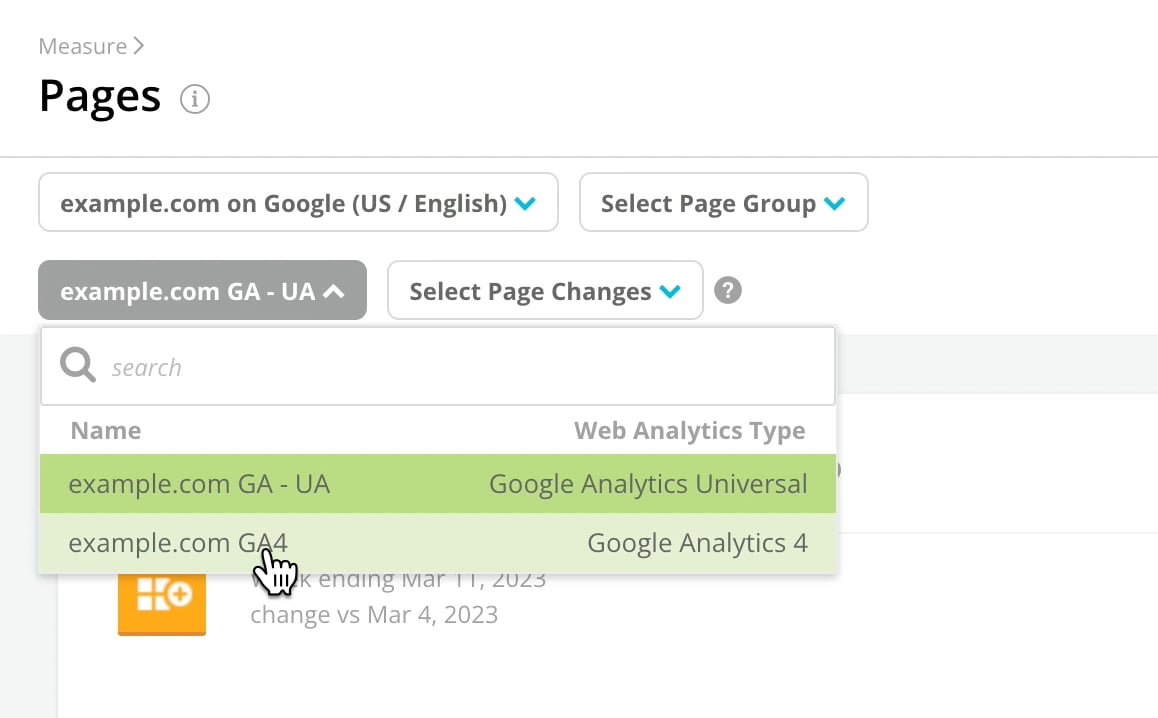
If you have multiple analytics integrations configured for the web property you chose above, select the integration you want to see data from.\\
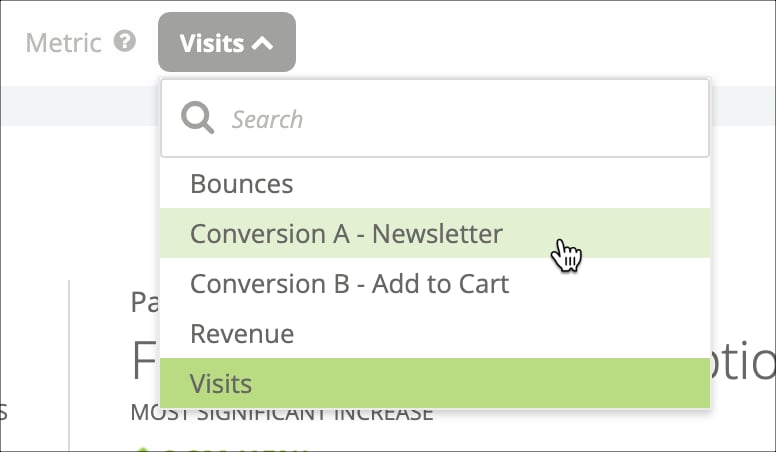
 Choose a metric from your analytics provider to trend.\\
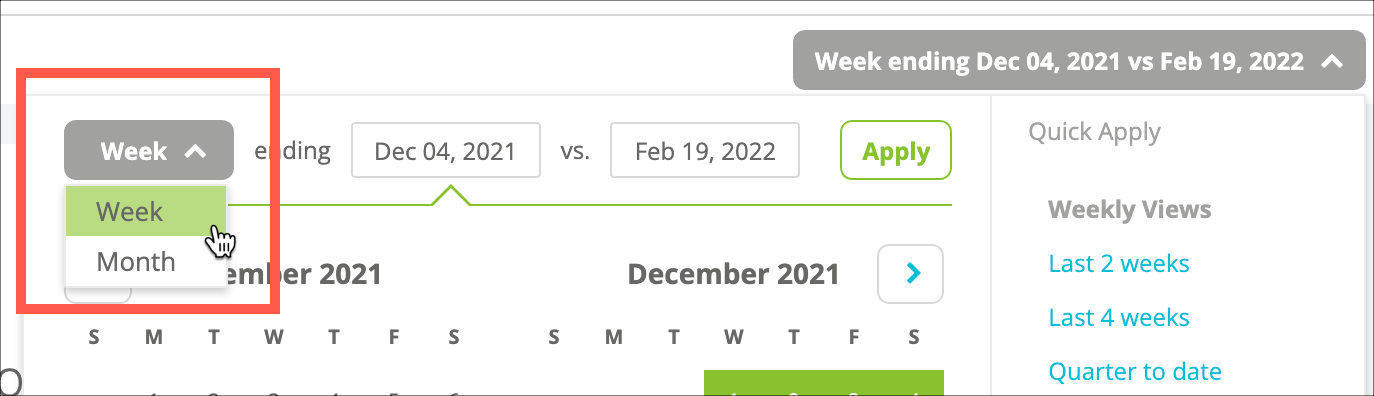
 If available, select whether the report shows weekly or monthly data.\\
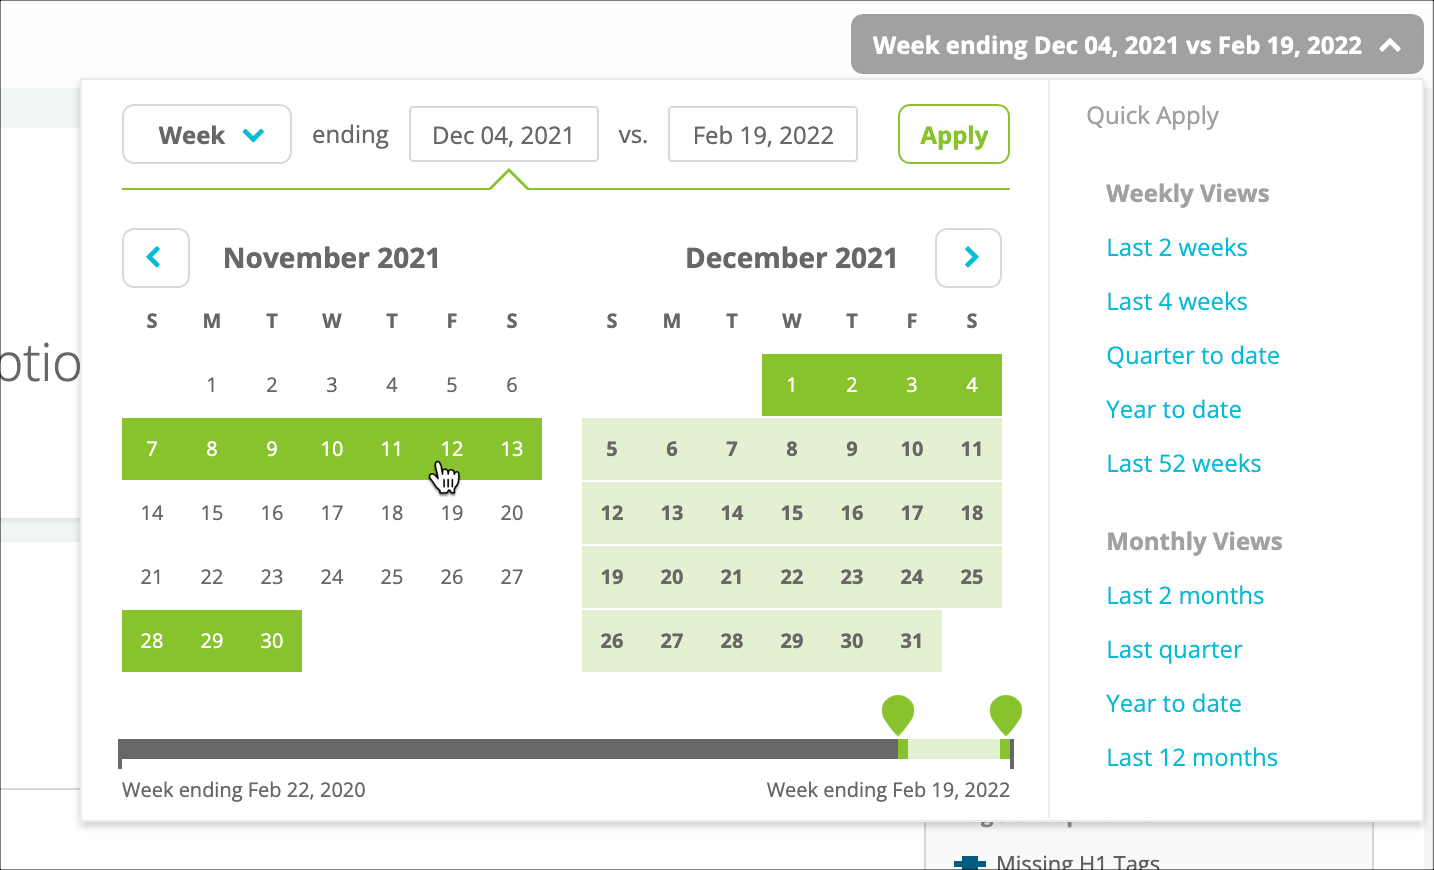
 Select the time period you want to see data for.\\
 ### Review the Report
The summary bar includes:
* A high-level summary for the selected metric for the selected time period.
* A site-wide perspective of how much the selected data contributes to the overall organic performance of the site.
* The page groups with the most significant increase and decrease, including the percentage change in the values.
### Review the Report
The summary bar includes:
* A high-level summary for the selected metric for the selected time period.
* A site-wide perspective of how much the selected data contributes to the overall organic performance of the site.
* The page groups with the most significant increase and decrease, including the percentage change in the values.
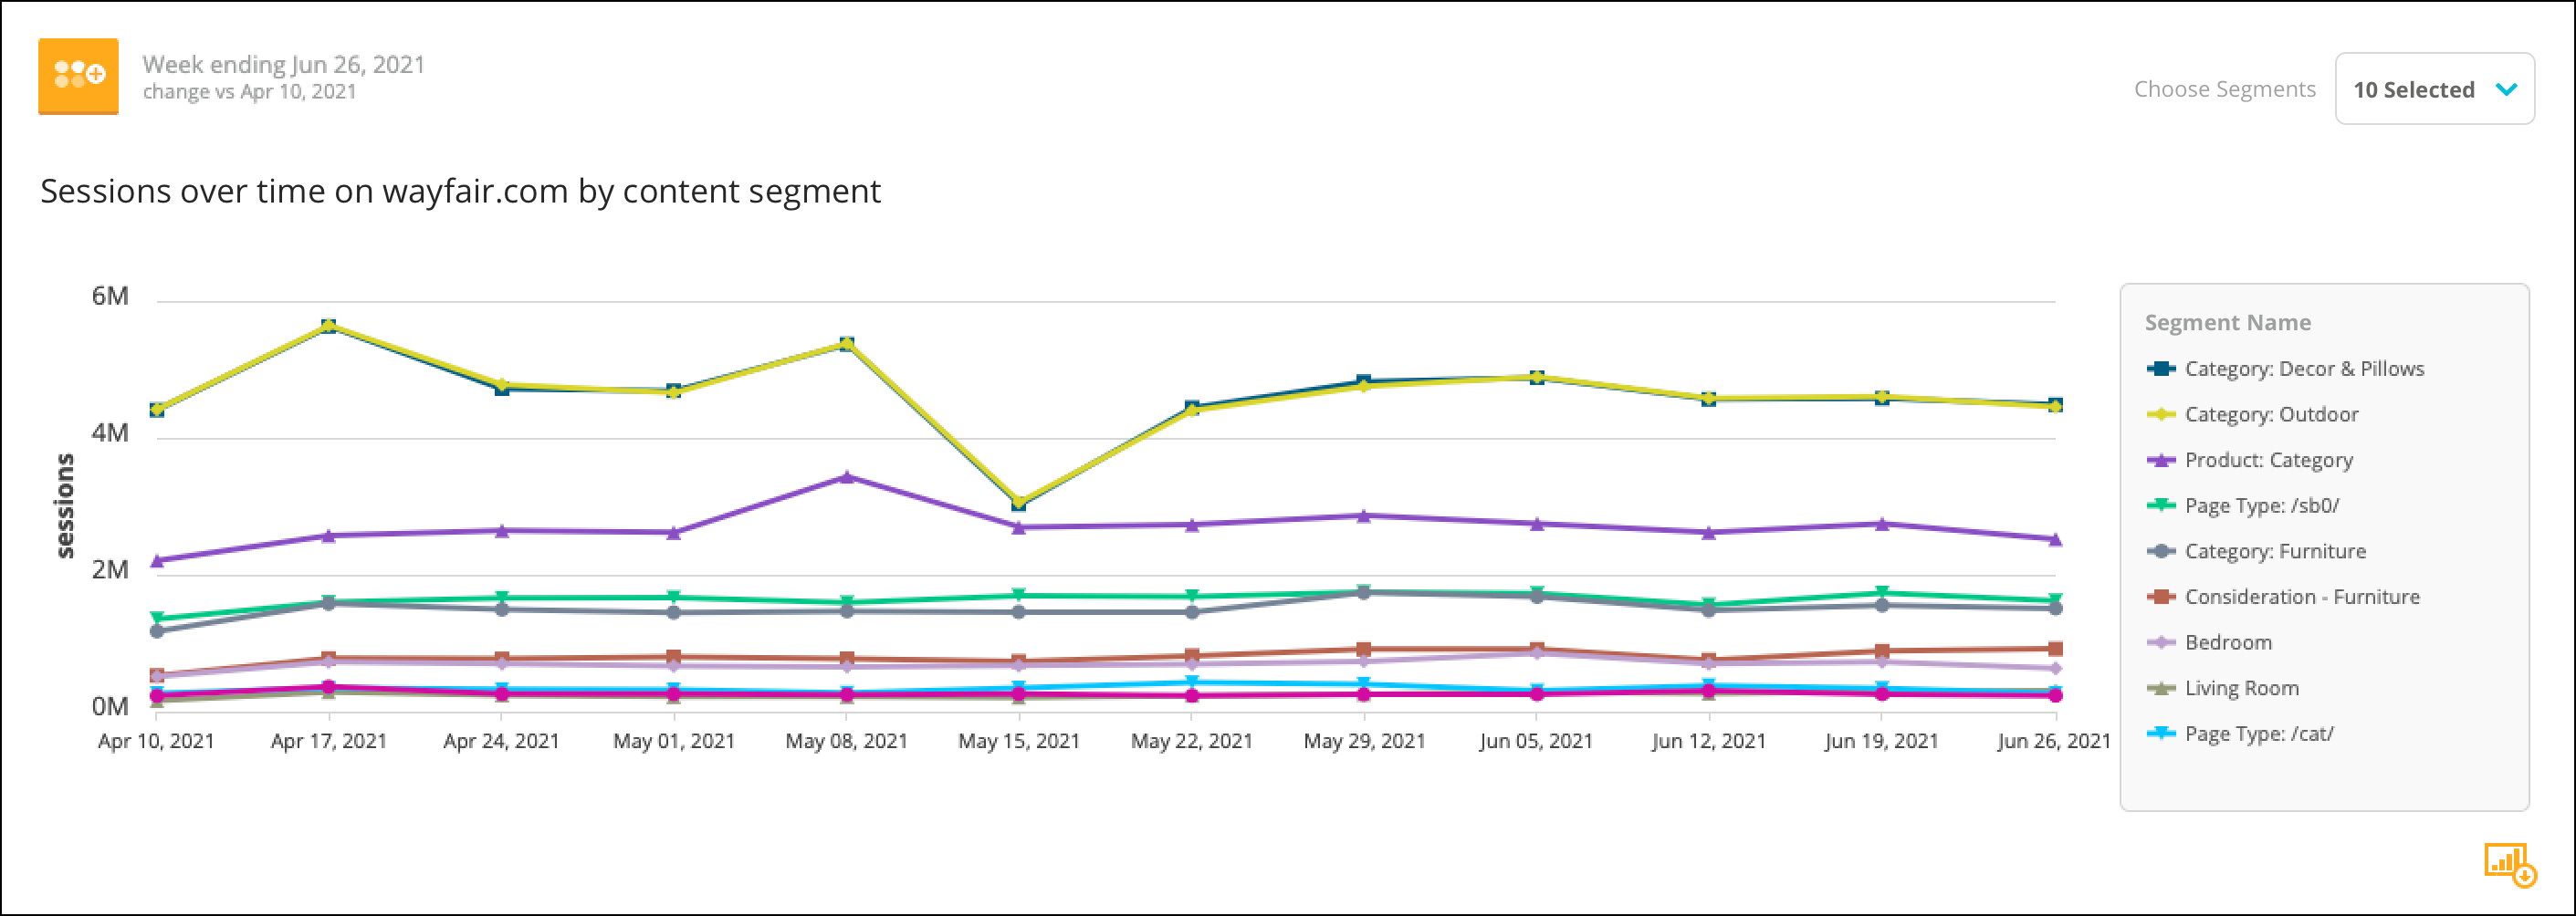
 The line graph lets you compare your selected metric trended over the selected time period. You can also hover over a data point on the graph to see details about that week or month.
 \
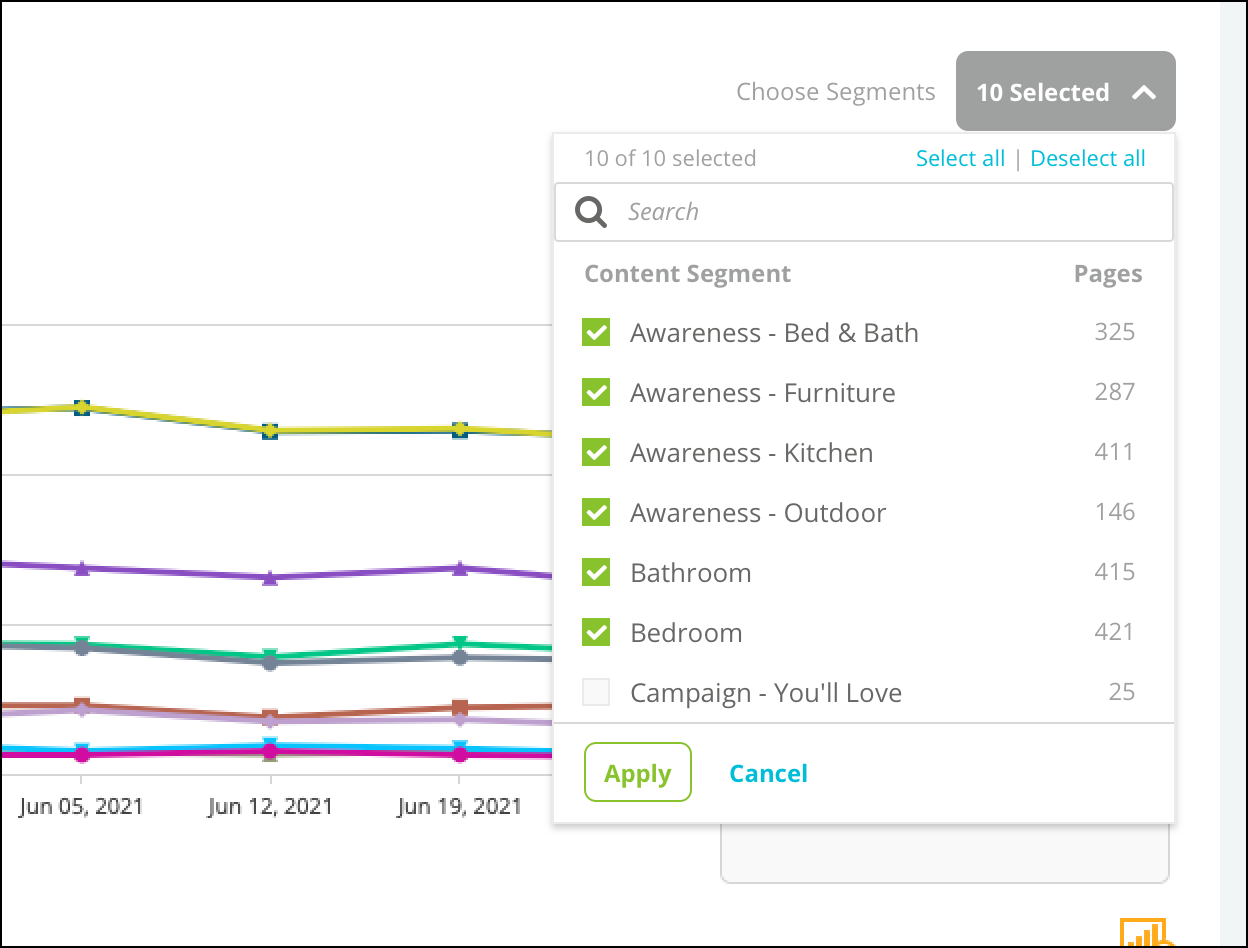
Select or clear the page groups from the selector to show only those page groups you want to compare. \\
\
Select or clear the page groups from the selector to show only those page groups you want to compare. \\
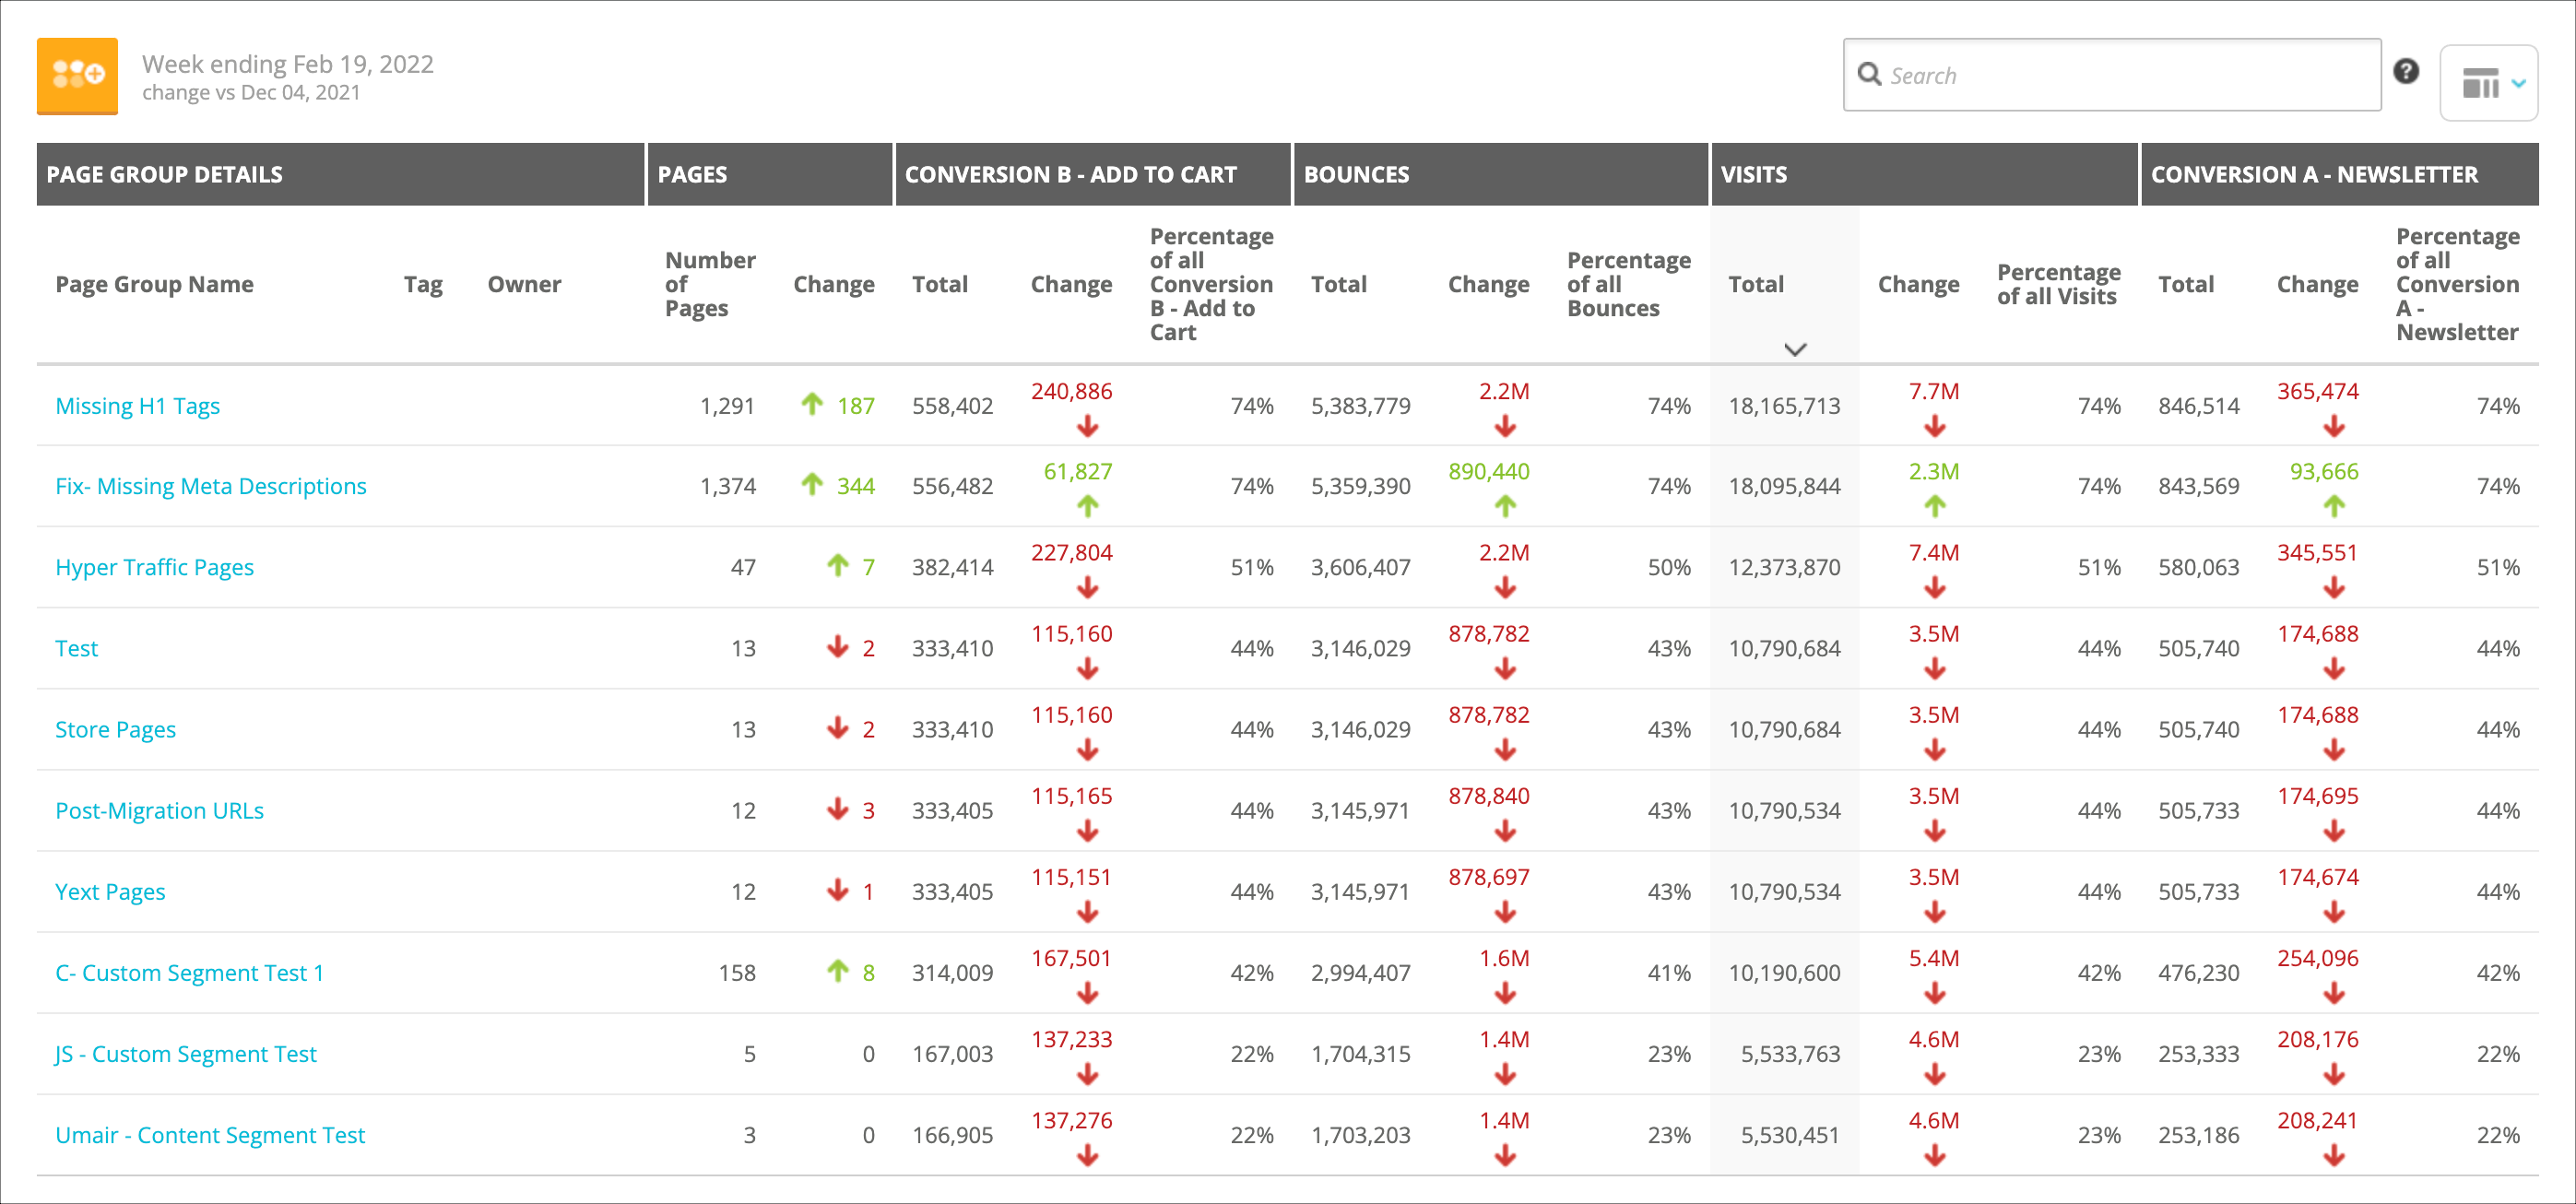
 The **Page Group** **Details** table includes details and metrics for each of your page groups. Click on a page group in the **Page Group Name** column to jump to the [**Pages**](/docs/intelligence/pages-conductor-intelligence/) report, filtered to show data for that page group.\\
 ## Using Page Groups
* [Uncover opportunity by identifying underperforming content](https://app.conductor.com/u/community/?ms_url=%2Fcourses%2Fa02cd5ee-d82e-41e8-b6f5-8bbd04830723%2Fstep%2F56bb5260-0d65-49cc-bbf9-57e1f39e903e)
* [Create a workspace to track your content's performance](https://app.conductor.com/u/community/?ms_url=%2Fcourses%2Fcf5d38ef-6e33-4b47-84bd-1c2817f44b6b%2Fstep%2Ff176a566-4e97-42bb-8fce-d66676d9b056)
* [Building an executive report](https://app.conductor.com/u/community/?ms_url=%2Fcourses%2Fcf5d38ef-6e33-4b47-84bd-1c2817f44b6b%2Fstep%2F248a95f8-49a9-4c6a-ac10-3d8be1aef9b1)
* [Target optimizations to your buyer personas at each stage of their buyer's journey](https://app.conductor.com/u/community?ms_url=%2Fcourses%2Fe658b180-d397-4557-9150-94300a99c78e%2Fstep%2F38ba08f9-db61-4a6f-8cdb-aca213ec020b)
## Using Page Groups
* [Uncover opportunity by identifying underperforming content](https://app.conductor.com/u/community/?ms_url=%2Fcourses%2Fa02cd5ee-d82e-41e8-b6f5-8bbd04830723%2Fstep%2F56bb5260-0d65-49cc-bbf9-57e1f39e903e)
* [Create a workspace to track your content's performance](https://app.conductor.com/u/community/?ms_url=%2Fcourses%2Fcf5d38ef-6e33-4b47-84bd-1c2817f44b6b%2Fstep%2Ff176a566-4e97-42bb-8fce-d66676d9b056)
* [Building an executive report](https://app.conductor.com/u/community/?ms_url=%2Fcourses%2Fcf5d38ef-6e33-4b47-84bd-1c2817f44b6b%2Fstep%2F248a95f8-49a9-4c6a-ac10-3d8be1aef9b1)
* [Target optimizations to your buyer personas at each stage of their buyer's journey](https://app.conductor.com/u/community?ms_url=%2Fcourses%2Fe658b180-d397-4557-9150-94300a99c78e%2Fstep%2F38ba08f9-db61-4a6f-8cdb-aca213ec020b)