> ## Documentation Index
> Fetch the complete documentation index at: https://www.conductor.com/docs/llms.txt
> Use this file to discover all available pages before exploring further.
# Pages (Conductor Intelligence)
> Measure how your pages are performing across organic metrics, integrated analytics, page groups, and year-over-year views.
First time in the new Pages report? Read our [Quick Start Guide](https://app.conductor.com/u/community?ms_url=%2Fdocuments%2Fc4dd8dbd-a350-41ad-be25-c1dae02ceb4b) to the new experience.
Keep in mind, an **Admin** user at your organization will need to choose the subdomains and pages you want to continue to report on. Learn more in our [Pages Onboarding Guide](https://app.conductor.com/u/community?ms_url=%2Fdocuments%2Fbd7d479d-5398-40df-93a3-971279480044).
The Pages report gives you a complete, unified view of how your website and content are performing—and why. Built on Conductor's data platform, it brings your web analytics, technical SEO, AI search, and keyword data together in one place, with precision, flexibility, and fidelity. Use them to measure overall website performance, investigate individual pages, and pinpoint exactly where to focus.
**Performance** > **Websites** > [**Pages**](http://app.conductor.com/u/pages)
The Pages report is broken into two tabs:
* The **Overview** tab provides a visual trend of your website traffic, on-site engagement performance, and technical insights.
* The **Pages** tab provides a highly flexible view into the unified performance and technical data for all your URLs.
Across these tabs, you can understand and measure website performance in organic and AI search and carry out technical investigation.
## Determine the scope of your report
The primary way to set your reporting scope is by defining the subdomains you want to see page data for. Admin users can do this in the [Pages & Crawling](/docs/intelligence/pages-and-crawling-setup/) settings activity.
To focus on the most relevant and useful data to address your specific goals, you can choose the context for which you want to see data.
Configure the following controls at the top of the report to determine the data the Pages report shows:
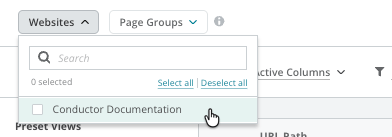
* Use the **Websites** menu to choose one or more of your tracked web properties you want to see data for. You might review aggregated performance across all your websites to measure total traffic, conversions, and other on-site engagement with multi-domain rollup reporting.
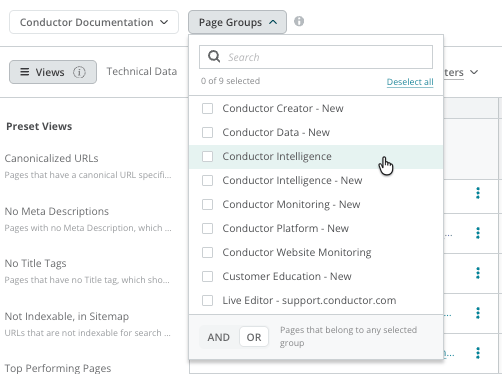
 * Use the **Page Groups** menu to choose a page group if you want to focus on a particular subset of pages on your site.
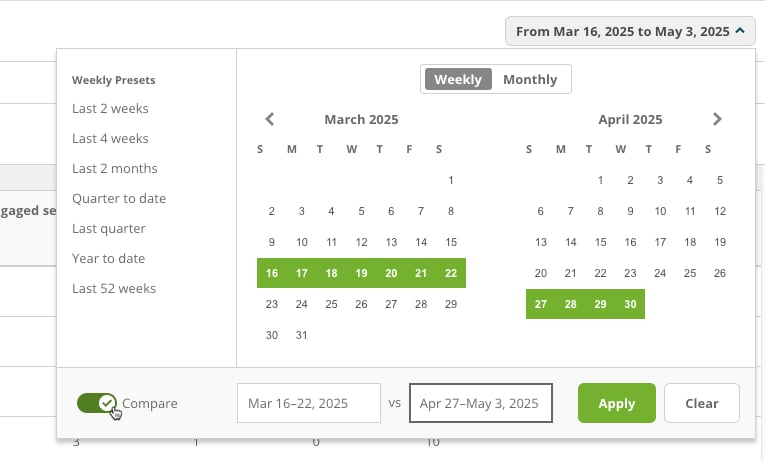
 * Use the **Date Picker** to select the date range and frequency you want to report on. You can also enable the **Compare** toggle to compare date ranges.
 ## Compare your performance across AI and organic traffic
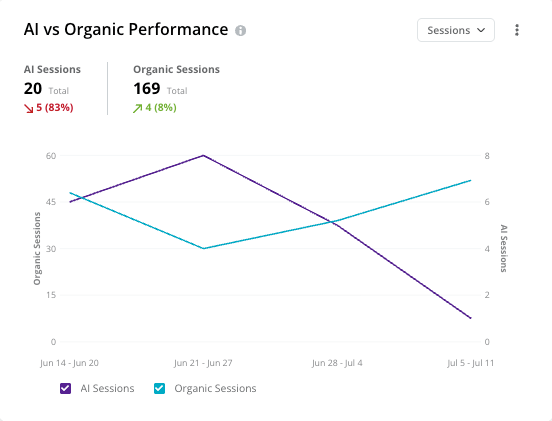
Measure and compare trends in total Sessions (or another measured metric) between AI Search and Organic sources with the **AI vs Organic Performance** chart. Specify which metrics you want to compare performance for and see aggregated AI performance across all major AI Search engines (ChatGPT, Perplexity, Claude, Copilot, Gemini, Grok, and OpenAI API).
## Compare your performance across AI and organic traffic
Measure and compare trends in total Sessions (or another measured metric) between AI Search and Organic sources with the **AI vs Organic Performance** chart. Specify which metrics you want to compare performance for and see aggregated AI performance across all major AI Search engines (ChatGPT, Perplexity, Claude, Copilot, Gemini, Grok, and OpenAI API).
 ## Review your organic performance
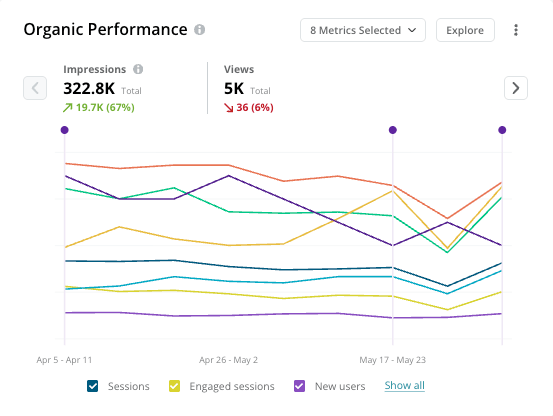
The **Organic Performance** widget shows a summary bar of your performance for each of your integrated web analytics metrics across your reporting time period, with a chart below showing how your site has performed over time. This widget appears only if you have integrated your organization's web analytics.
## Review your organic performance
The **Organic Performance** widget shows a summary bar of your performance for each of your integrated web analytics metrics across your reporting time period, with a chart below showing how your site has performed over time. This widget appears only if you have integrated your organization's web analytics.
 ## Review your performance across AI engines
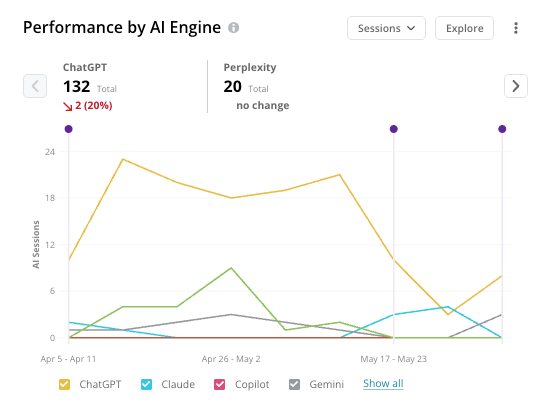
Measure traffic and subsequent on-site engagement trends driven by different AI search engine providers (ChatGPT, Perplexity, Claude, Copilot, Gemini, Grok, and OpenAI API) in the **Performance by AI Engine** chart.
## Review your performance across AI engines
Measure traffic and subsequent on-site engagement trends driven by different AI search engine providers (ChatGPT, Perplexity, Claude, Copilot, Gemini, Grok, and OpenAI API) in the **Performance by AI Engine** chart.
 ## Monitor your performance for prompts with citations
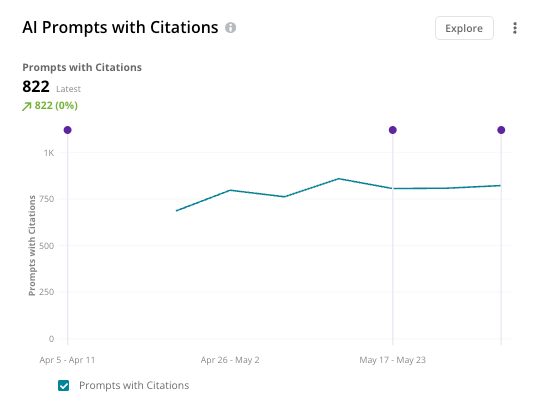
The AI Prompts with Citations widget measures the trend and total number of tracked prompts in which your pages are cited across selected websites during the reported time period. This aggregate calculation looks across all AI search engines and locations.
## Monitor your performance for prompts with citations
The AI Prompts with Citations widget measures the trend and total number of tracked prompts in which your pages are cited across selected websites during the reported time period. This aggregate calculation looks across all AI search engines and locations.
 ## Compare your page group performance
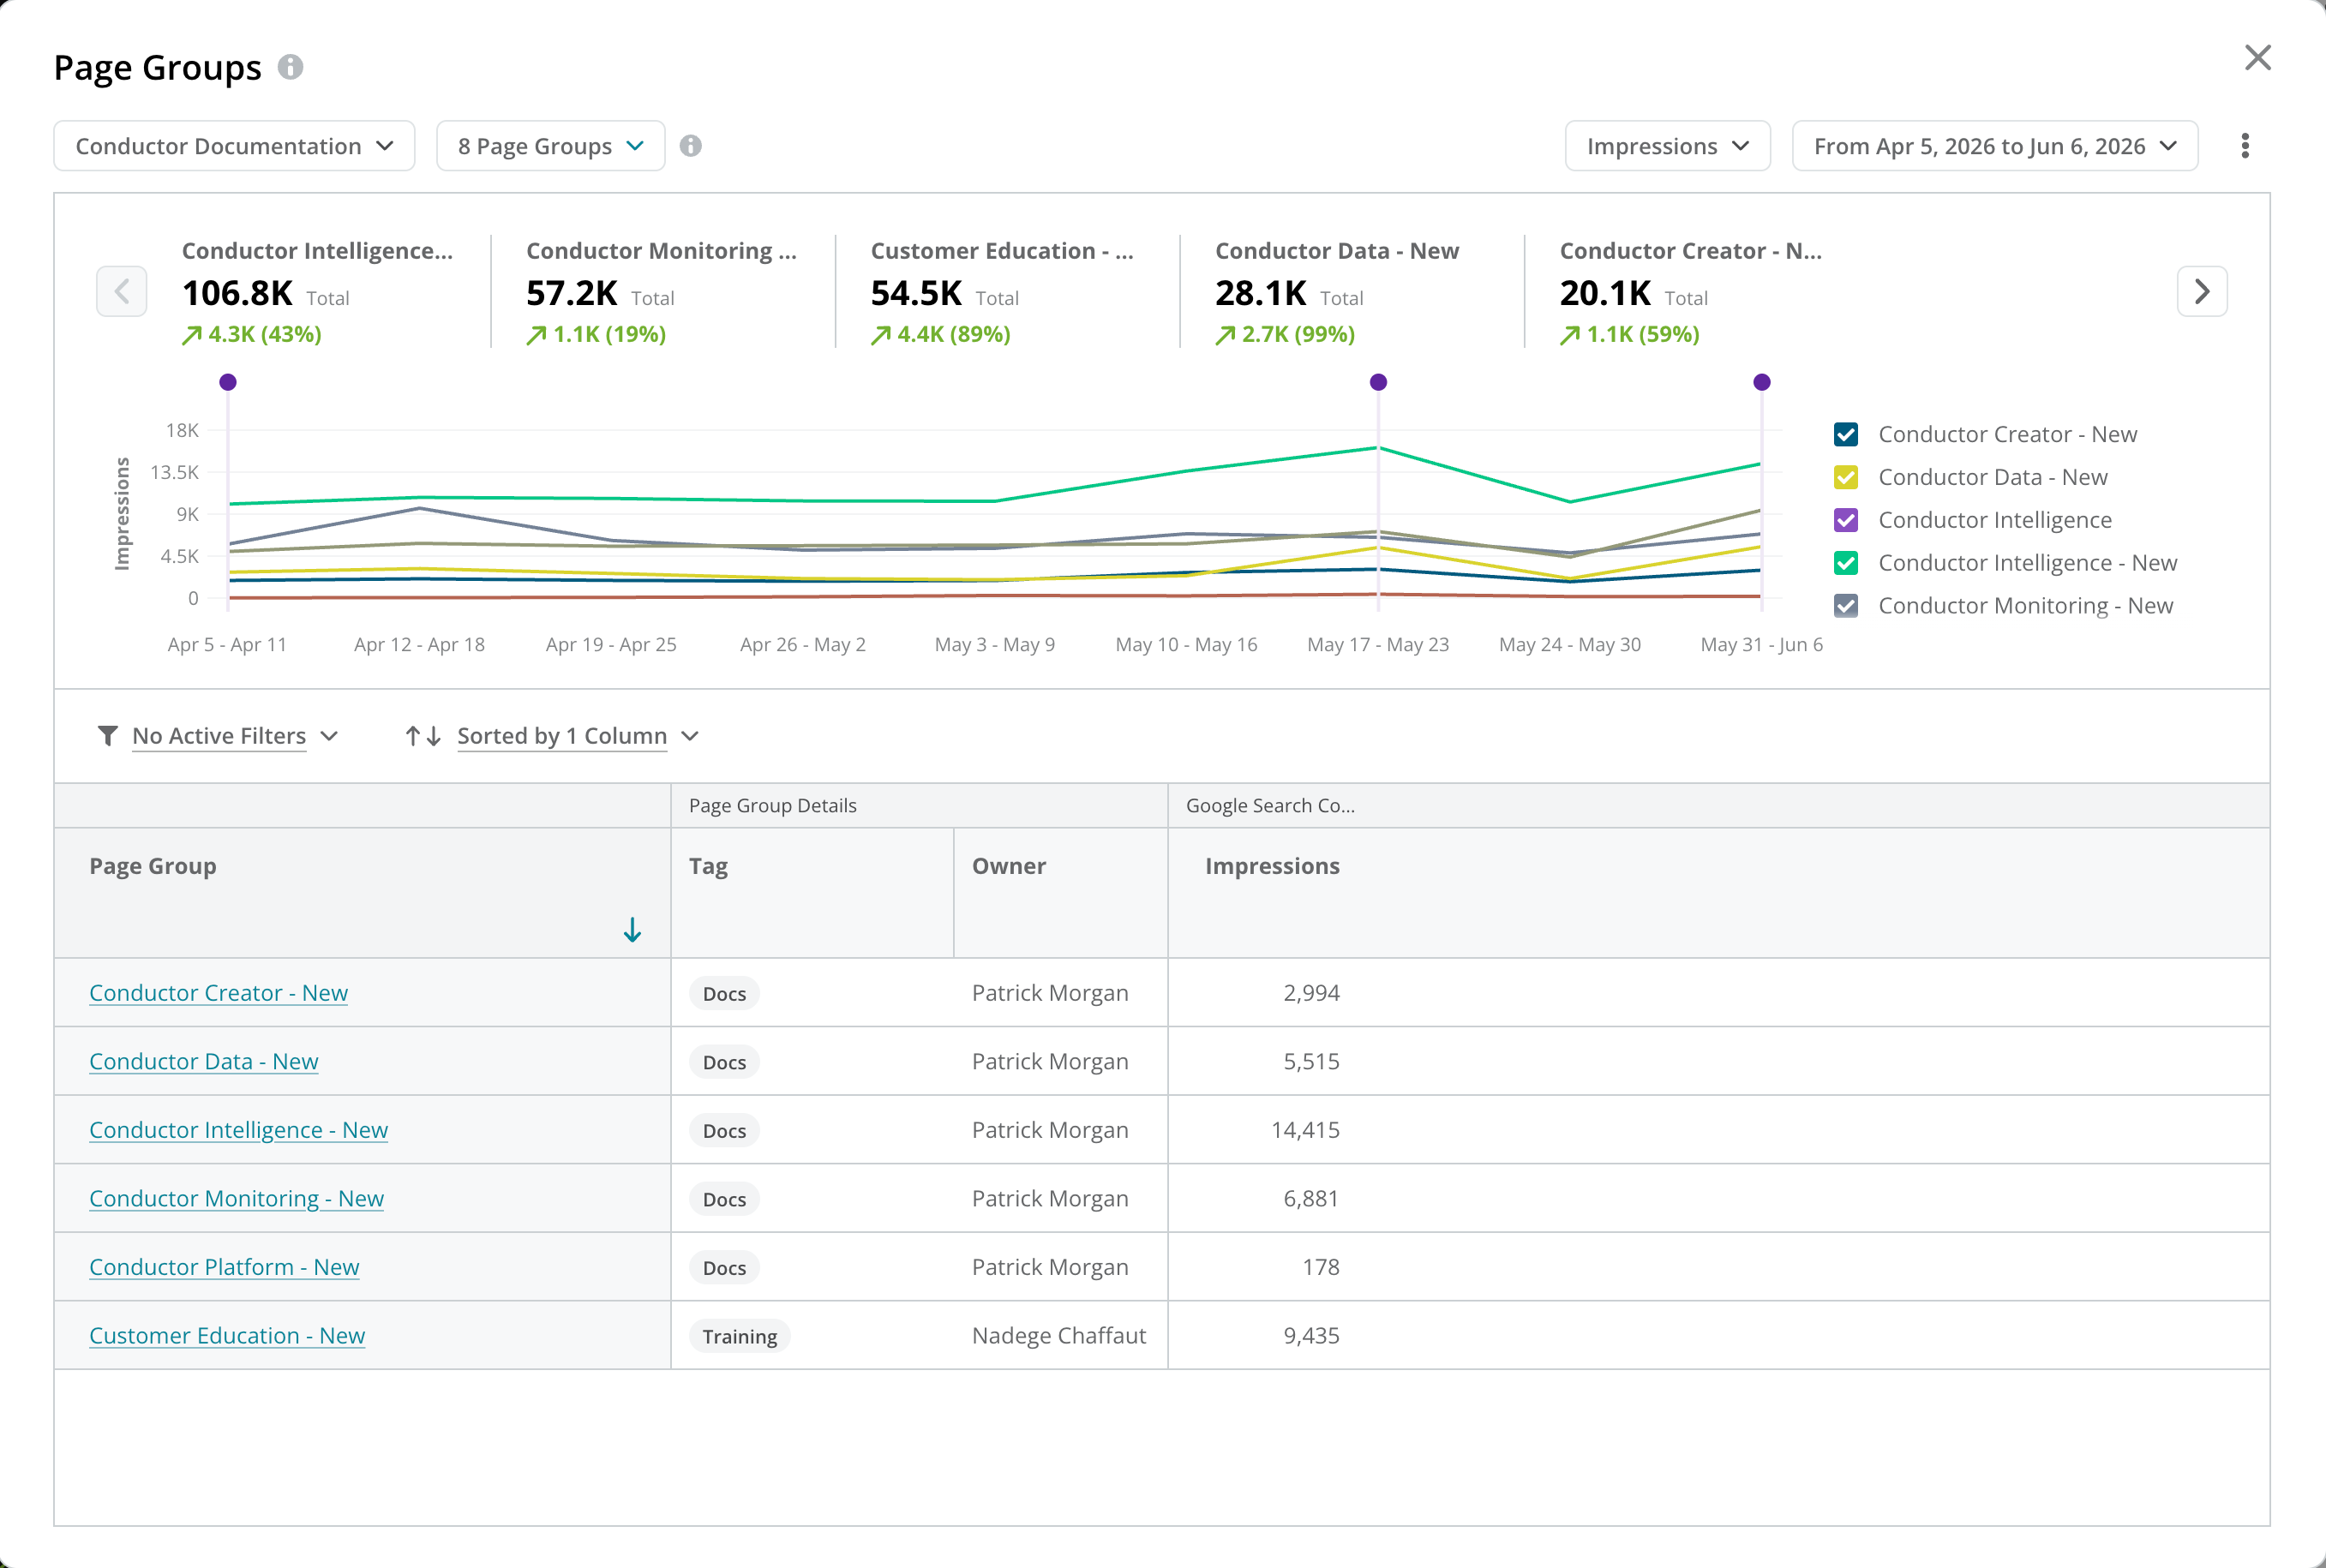
The **Page Groups** widget on the **Overview** tab gives you a quick view of how key groups of pages are performing at a glance. It shows top-line totals, period-over-period change, and a trend chart for your selected page groups, so you can see which content areas are gaining traction and compare multiple page groups over time. This widget brings your Organic Traffic, AI Referral Traffic, and Google Search Console insights together in one view.
## Compare your page group performance
The **Page Groups** widget on the **Overview** tab gives you a quick view of how key groups of pages are performing at a glance. It shows top-line totals, period-over-period change, and a trend chart for your selected page groups, so you can see which content areas are gaining traction and compare multiple page groups over time. This widget brings your Organic Traffic, AI Referral Traffic, and Google Search Console insights together in one view.
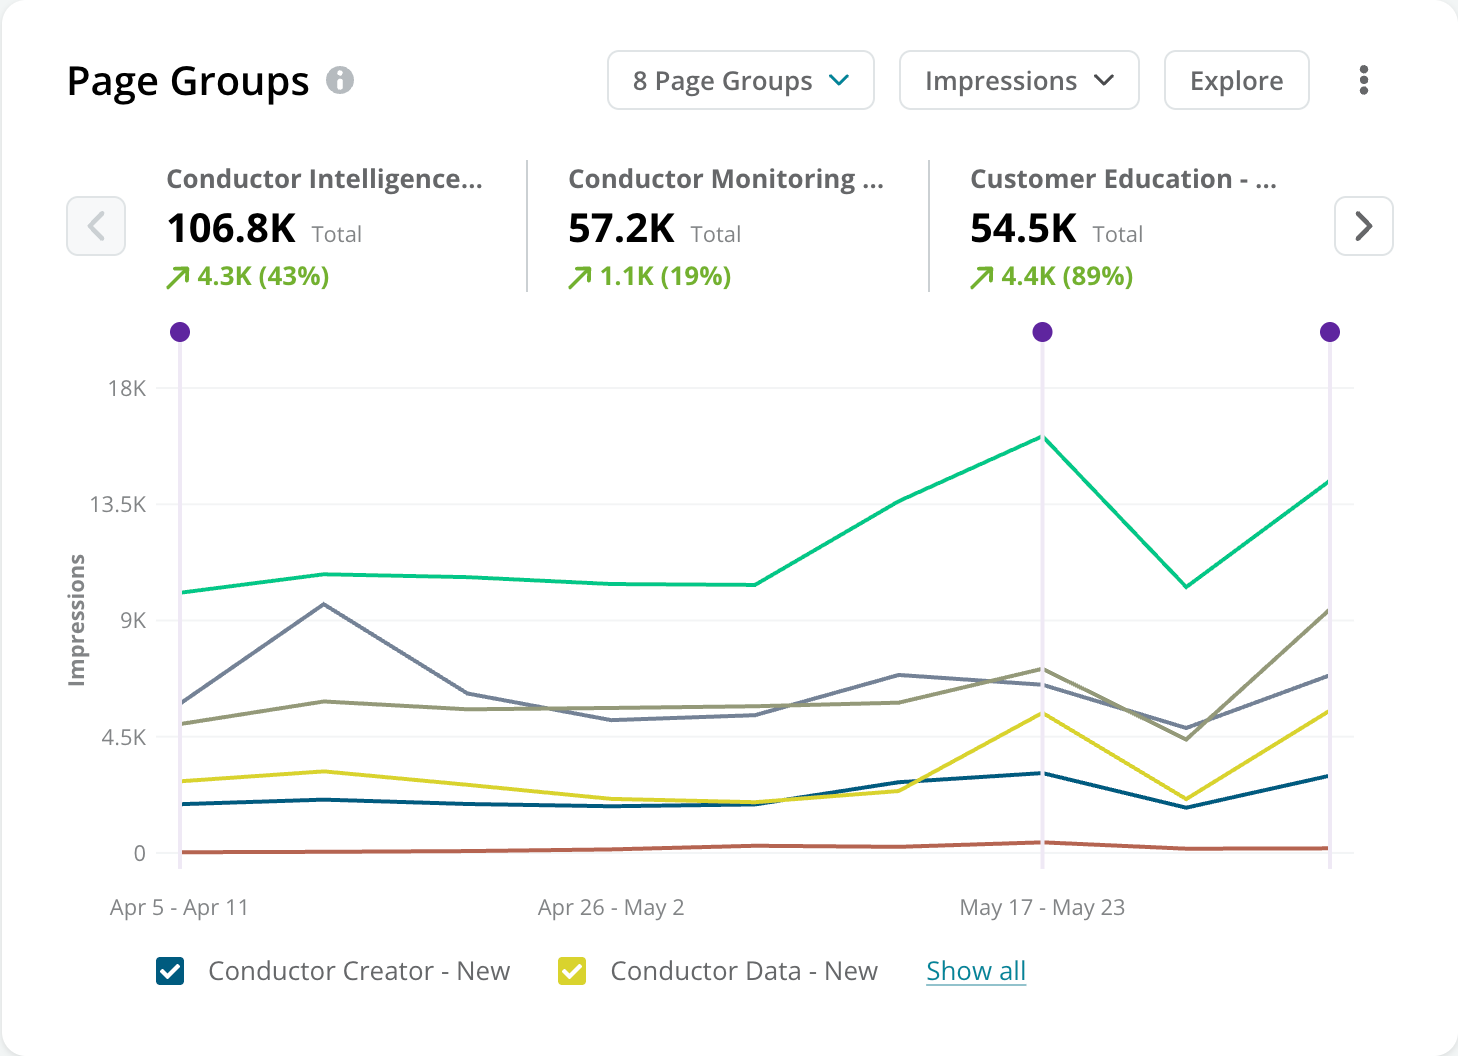 Click **Explore** to view a breakdown of your page group performance with sortable table data, filters, and ownership details. You can also download this data with all available performance metrics.
 ## Compare year-over-year performance
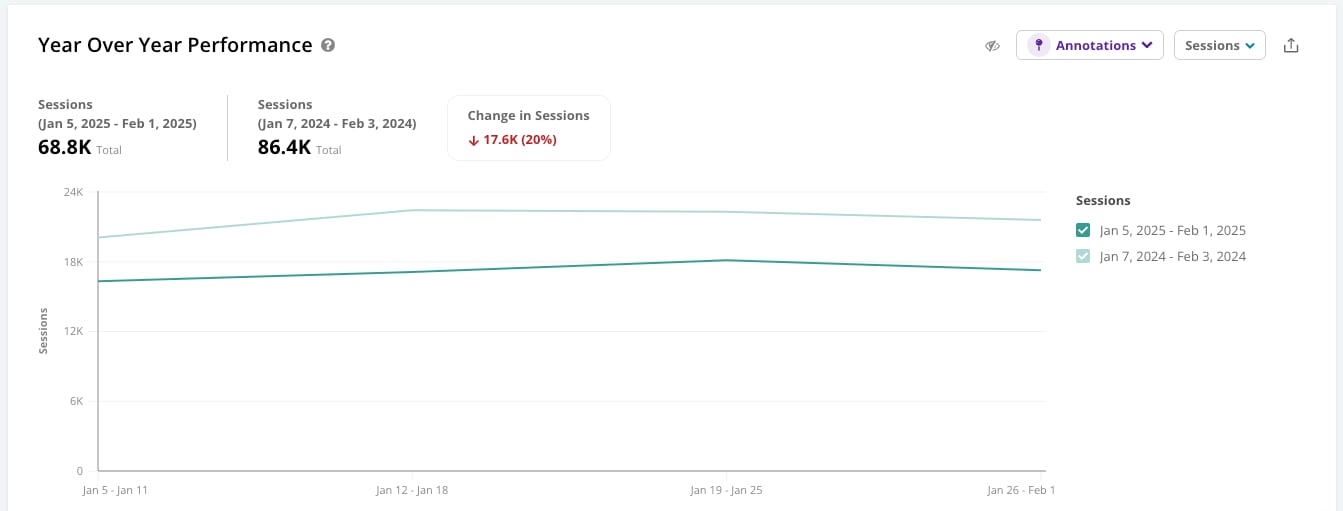
To quickly identify trends, measure changes between the reporting period and the previous year, and report on high-level KPIs, compare your performance across years in the **Year Over Year Performance** chart.
## Compare year-over-year performance
To quickly identify trends, measure changes between the reporting period and the previous year, and report on high-level KPIs, compare your performance across years in the **Year Over Year Performance** chart.
 ## See technical SEO data side-by-side with analytics metrics
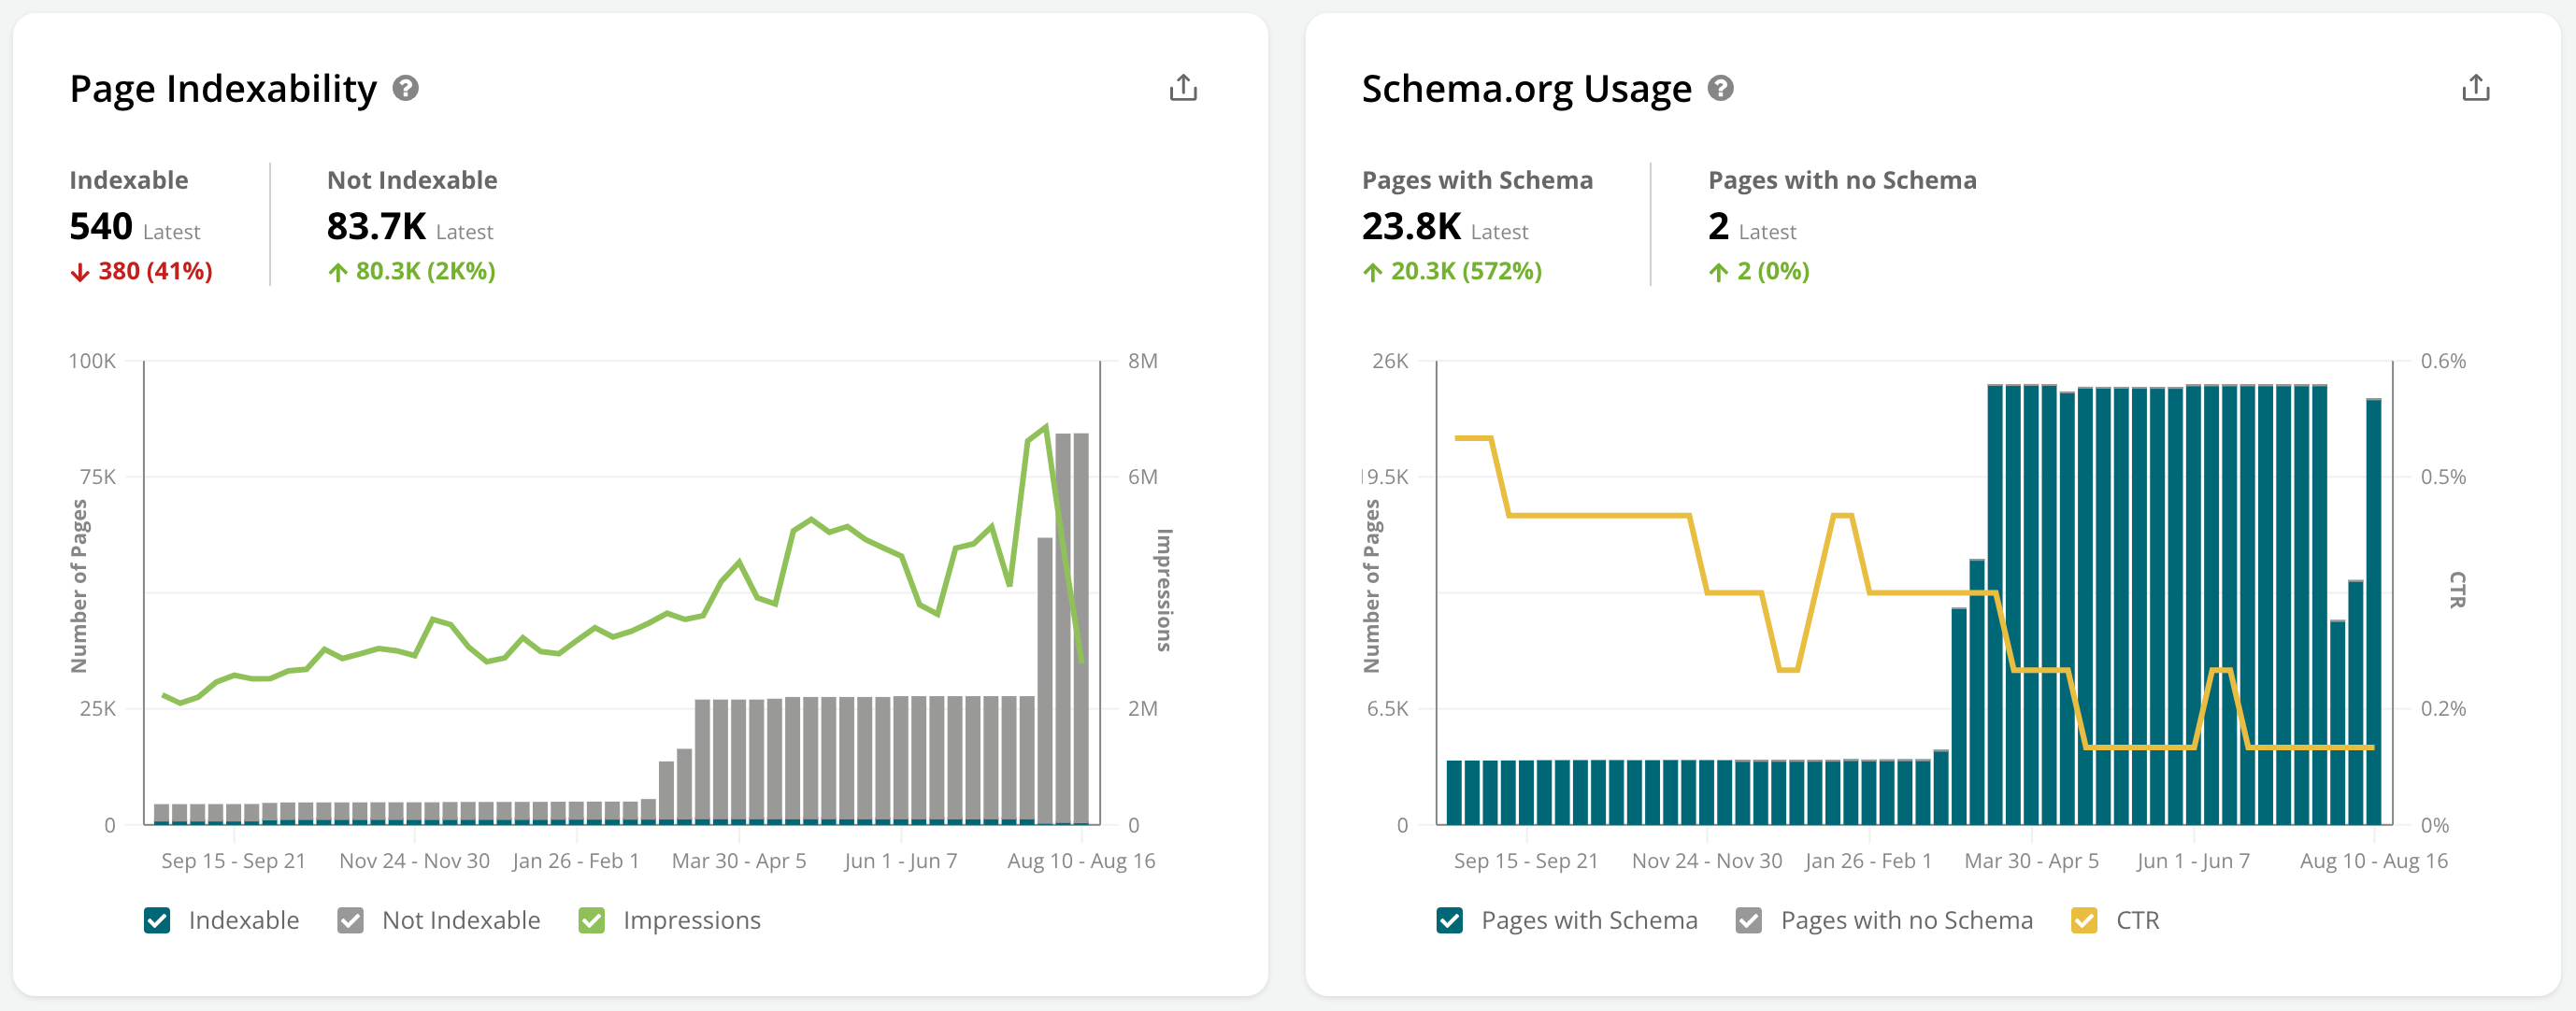
In the **Overview** tab, see trended technical insights about your **Page Indexability** and **Schema.org Usage**.
## See technical SEO data side-by-side with analytics metrics
In the **Overview** tab, see trended technical insights about your **Page Indexability** and **Schema.org Usage**.
 ## Explore your charts' underlying data
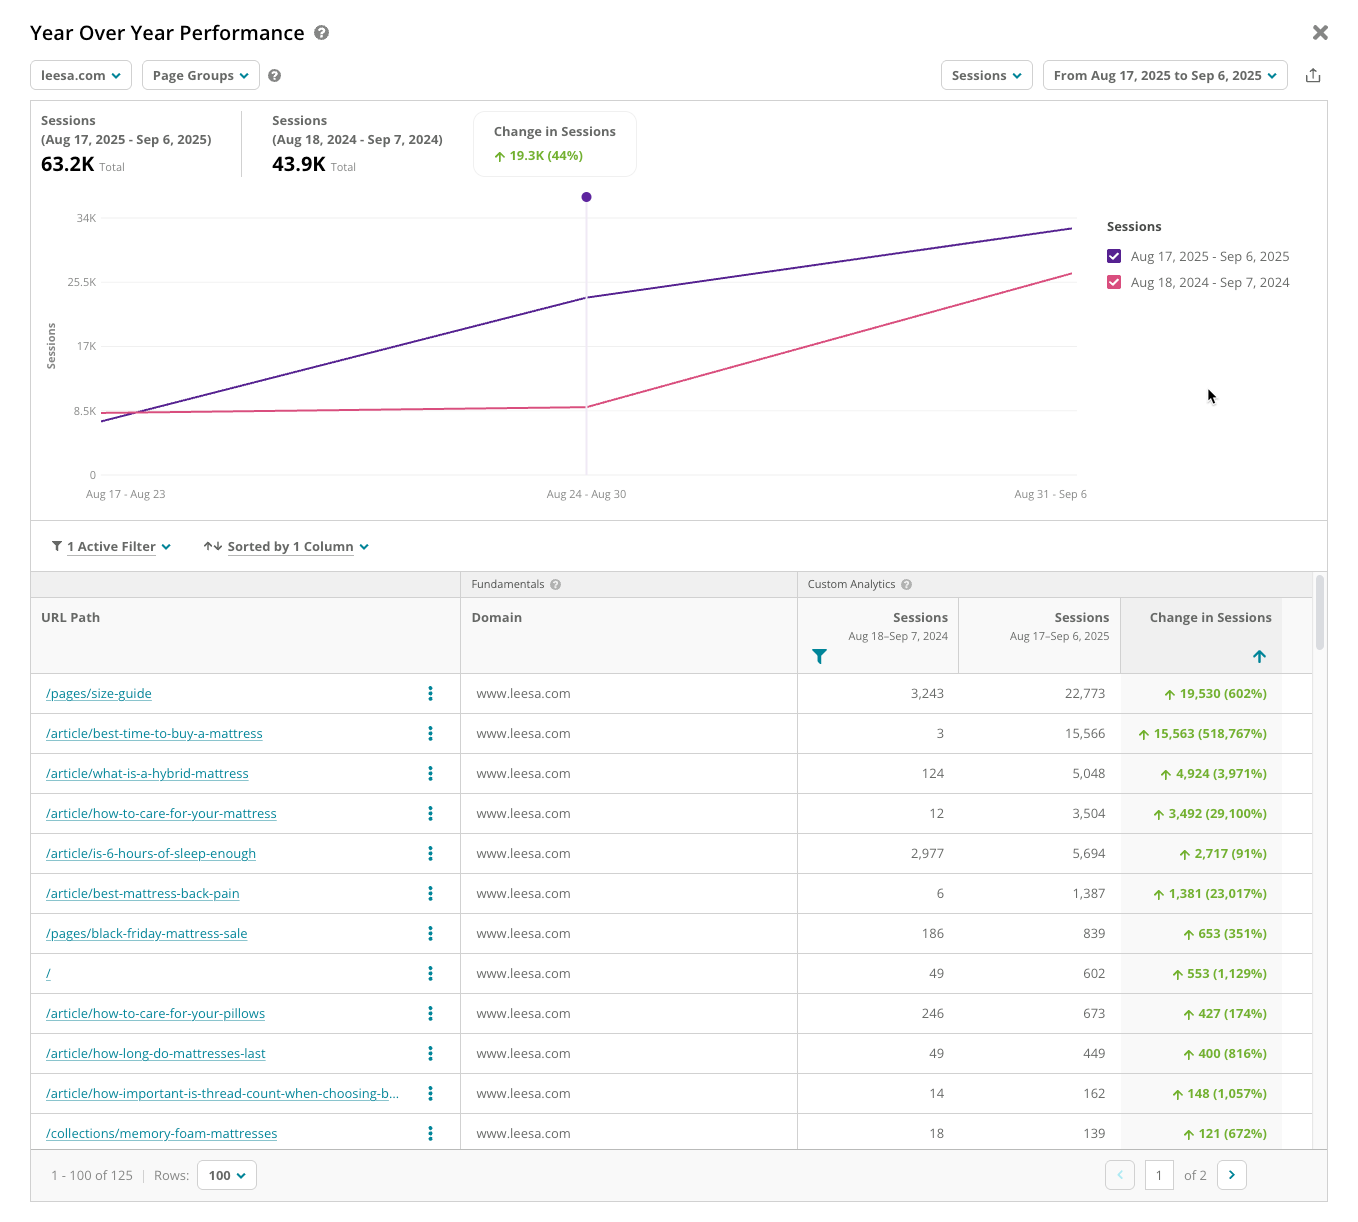
To understand more about the data shown in charts on the **Overview** tab, use the **Explore** button to launch a report where you can see the pages that are driving the performance visualized in the chart.
In the **Explore** window, you can update the scope of your report (such as page group, reporting dates, and metrics) to dig into the pages driving your performance.
## Explore your charts' underlying data
To understand more about the data shown in charts on the **Overview** tab, use the **Explore** button to launch a report where you can see the pages that are driving the performance visualized in the chart.
In the **Explore** window, you can update the scope of your report (such as page group, reporting dates, and metrics) to dig into the pages driving your performance.
 ## Review your Pages table
In the **Pages** tab, investigate each page's performance with web analytics, AI traffic, engagement data, and technical data side-by-side.
* For analytics data, data is aggregated across your selected date range.
* For technical data, to provide clarity into your current technical issues, data reflects a weekly snapshot from the most recent week of your selected range.
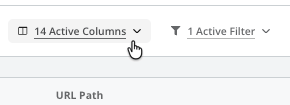
Columns are grouped by data type, and you can choose which columns to include in the table from the **Active Columns** menu.
## Review your Pages table
In the **Pages** tab, investigate each page's performance with web analytics, AI traffic, engagement data, and technical data side-by-side.
* For analytics data, data is aggregated across your selected date range.
* For technical data, to provide clarity into your current technical issues, data reflects a weekly snapshot from the most recent week of your selected range.
Columns are grouped by data type, and you can choose which columns to include in the table from the **Active Columns** menu.
 ### Fundamentals
Fundamentals columns provide core technical characteristics about your URLs. This snapshot data is pulled from the last week of the selected date range (or the last full week, in the monthly view).
Use this information to investigate the various types of URLs across your website, including their HTTPS security, [status codes](https://www.conductor.com/academy/http-status-codes/), and redirect targets for any [redirected pages](https://www.conductor.com/academy/redirects/).
Columns include:
* **Domain**
* **URL Type**
* **HTTPS**
* **Status Code**
* **Full URL**
* **URL Depth**
* **Redirect Target**
### Indexability
Indexability columns show whether your URLs are indexable for search engines, and enable investigation of indexation issues. This snapshot data is pulled from the last week of the selected date range (or the last full week, in the monthly view).
Use this information to ensure you are appropriately [communicating crawling and indexing preferences](https://www.conductor.com/academy/control-crawling-indexing/) to search engines, to investigate potential indexation issues influenced by your [XML sitemap](https://www.conductor.com/academy/xml-sitemap/), [robots.txt](https://www.conductor.com/academy/robotstxt/) or [meta robots](https://www.conductor.com/academy/meta-robots-tag/) directives, and to ensure you're effectively handling duplicate content with [canonical URLs](https://www.conductor.com/academy/canonical/).
Columns include:
* **Indexable**
* **In XML Sitemap**
* **Robots.txt**
* **Meta Robots**
* **X-Robots-Tag**
* **Canonical URL**
* **Canonical Type**
### Content
Content columns surface metadata and on-page content from your pages. This snapshot data is pulled from the last week of the selected date range (or the last full week, in the monthly view).
Use this information to review the following for each page, all of which are highly relevant for [On-page SEO](https://www.conductor.com/academy/on-page-seo-content/):
* [Title Tag](https://www.conductor.com/academy/title-tag/)
* [Meta Descriptions](https://www.conductor.com/academy/how-to-write-a-meta-description/)
* [H1](https://www.conductor.com/academy/headings/faq/h1/)
### Schema.org
**Schema.org** columns show structured markup that is applied across your pages, which helps search engines understand your content and can influence how it appears in SERPs. This snapshot data is pulled from the last week of the selected date range (or the last full week, in the monthly view).
Use this information to see where various [Schema.org](http://Schema.org) types are (or are not) being leveraged across your pages.
Columns include:
* **Schema.org Items**
* **Schema.org Types**
### Social
The Social column group provides insight into how [Open Graph](https://www.conductor.com/academy/open-graph/) and [Twitter Card](https://www.conductor.com/academy/twitter-cards/) structured markup is being leveraged across your pages, which can be used to explain your content's context and control the snippets shown on social media platforms.
This snapshot data is pulled from the last week of the selected date range (or the last full week, in the monthly view).
Columns include:
* **Open Graph Type**
* **Open Graph URL**
* **Open Graph Title**
* **Open Graph Description**
* **Open Graph Image**
* **Twitter Card**
* **Twitter Site**
* **Twitter Title**
* **Twitter Description**
* **Twitter Image**
### AI Citations
AI Citations columns bring context to how often your pages are being cited in AI search results and for which of your tracked AI Topics. These values look across all AI search engines and locations. Columns include:
* **Prompts with Citations**
* **AI Topics**
### Google Search Console
The Google Search Console column group shows engagement data for your pages integrated from GSC. Conductor collects data for pages with at least 1 Impression within the collection time period. This aggregate data is either a sum or an average (depending on the metric) for your selected date range or comparison time periods.
* **Impressions**
### Fundamentals
Fundamentals columns provide core technical characteristics about your URLs. This snapshot data is pulled from the last week of the selected date range (or the last full week, in the monthly view).
Use this information to investigate the various types of URLs across your website, including their HTTPS security, [status codes](https://www.conductor.com/academy/http-status-codes/), and redirect targets for any [redirected pages](https://www.conductor.com/academy/redirects/).
Columns include:
* **Domain**
* **URL Type**
* **HTTPS**
* **Status Code**
* **Full URL**
* **URL Depth**
* **Redirect Target**
### Indexability
Indexability columns show whether your URLs are indexable for search engines, and enable investigation of indexation issues. This snapshot data is pulled from the last week of the selected date range (or the last full week, in the monthly view).
Use this information to ensure you are appropriately [communicating crawling and indexing preferences](https://www.conductor.com/academy/control-crawling-indexing/) to search engines, to investigate potential indexation issues influenced by your [XML sitemap](https://www.conductor.com/academy/xml-sitemap/), [robots.txt](https://www.conductor.com/academy/robotstxt/) or [meta robots](https://www.conductor.com/academy/meta-robots-tag/) directives, and to ensure you're effectively handling duplicate content with [canonical URLs](https://www.conductor.com/academy/canonical/).
Columns include:
* **Indexable**
* **In XML Sitemap**
* **Robots.txt**
* **Meta Robots**
* **X-Robots-Tag**
* **Canonical URL**
* **Canonical Type**
### Content
Content columns surface metadata and on-page content from your pages. This snapshot data is pulled from the last week of the selected date range (or the last full week, in the monthly view).
Use this information to review the following for each page, all of which are highly relevant for [On-page SEO](https://www.conductor.com/academy/on-page-seo-content/):
* [Title Tag](https://www.conductor.com/academy/title-tag/)
* [Meta Descriptions](https://www.conductor.com/academy/how-to-write-a-meta-description/)
* [H1](https://www.conductor.com/academy/headings/faq/h1/)
### Schema.org
**Schema.org** columns show structured markup that is applied across your pages, which helps search engines understand your content and can influence how it appears in SERPs. This snapshot data is pulled from the last week of the selected date range (or the last full week, in the monthly view).
Use this information to see where various [Schema.org](http://Schema.org) types are (or are not) being leveraged across your pages.
Columns include:
* **Schema.org Items**
* **Schema.org Types**
### Social
The Social column group provides insight into how [Open Graph](https://www.conductor.com/academy/open-graph/) and [Twitter Card](https://www.conductor.com/academy/twitter-cards/) structured markup is being leveraged across your pages, which can be used to explain your content's context and control the snippets shown on social media platforms.
This snapshot data is pulled from the last week of the selected date range (or the last full week, in the monthly view).
Columns include:
* **Open Graph Type**
* **Open Graph URL**
* **Open Graph Title**
* **Open Graph Description**
* **Open Graph Image**
* **Twitter Card**
* **Twitter Site**
* **Twitter Title**
* **Twitter Description**
* **Twitter Image**
### AI Citations
AI Citations columns bring context to how often your pages are being cited in AI search results and for which of your tracked AI Topics. These values look across all AI search engines and locations. Columns include:
* **Prompts with Citations**
* **AI Topics**
### Google Search Console
The Google Search Console column group shows engagement data for your pages integrated from GSC. Conductor collects data for pages with at least 1 Impression within the collection time period. This aggregate data is either a sum or an average (depending on the metric) for your selected date range or comparison time periods.
* **Impressions**
Impressions measures the total times across your selected time period that someone saw a link to your page on Google. Learn more about how Google calculates Impressions [here](https://support.google.com/webmasters/answer/7042828?hl=en#impressions).
* **Clicks**
Clicks measures the total times across your selected time period that someone clicked a link from Google to your page. Learn more about how Google calculates Clicks [here](https://support.google.com/webmasters/answer/7042828?hl=en#click).
* **CTR**
Average click-through rate (CTR) is the percentage of impressions that resulted in a click.
* **Average Position**
Average Position measures the relative ranking of the position of your page link on Google. Learn more about how Google calculates Average Position [here](https://support.google.com/webmasters/answer/7042828?hl=en#position).
### Analytics - AI Search
This column group provides AI Search performance measurements for all metrics integrated from your analytics provider, aggregated across the selected date range and all supported AI engines.
Supported engines include ChatGPT, Perplexity, Claude, Copilot, Gemini, Grok, and OpenAI API.
Use this information to measure and investigate traffic and on-site engagement patterns driven from AI Search results.
### Analytics - \[AI Engine]
This column group provides AI Search performance data for all metrics integrated from your analytics provider, aggregated across the selected date range and for each supported AI engine.
Supported engines include ChatGPT, Perplexity, Claude, Copilot, Gemini, Grok, and OpenAI API.
Use this information to measure and investigate traffic and on-site engagement patterns driven from AI Search results for each particular AI engine.
### Analytics - Organic
This column group provides organic performance measurements for all metrics integrated from your analytics provider, aggregated across the selected date range.
Use this information to measure and investigate traffic and on-site engagement patterns driven from organic search results.
## Find the keywords your pages perform best for
Each page in the **Pages** tab includes an expandable menu that shows the top five keywords the page performs for in search. Keywords are sourced from your tracked keywords—which appear linked so you can jump to [Keyword Details](/docs/intelligence/keyword-details/)—and from your integrated Google Search Console account. To see all the keywords that rank for a page, click the link at the bottom of the menu to jump to the **Keywords** tab in the **Page Details** report.
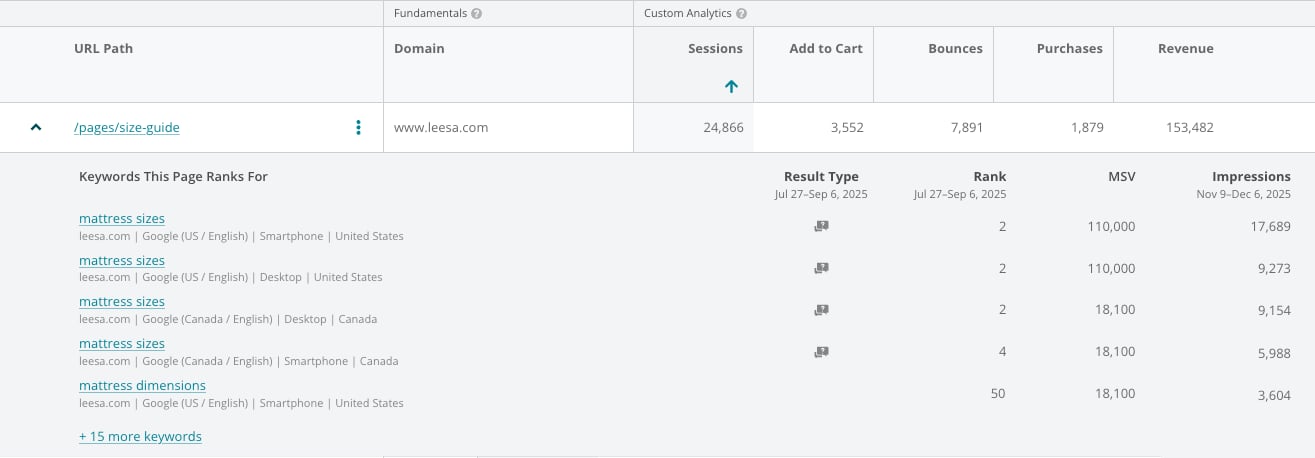 What counts as "best performing"? Keywords are sorted as follows:
* First, Google Search Console Impressions (if integrated)
* Rank (if tracked in Conductor)
* Monthly search volume
## Filter data flexibly
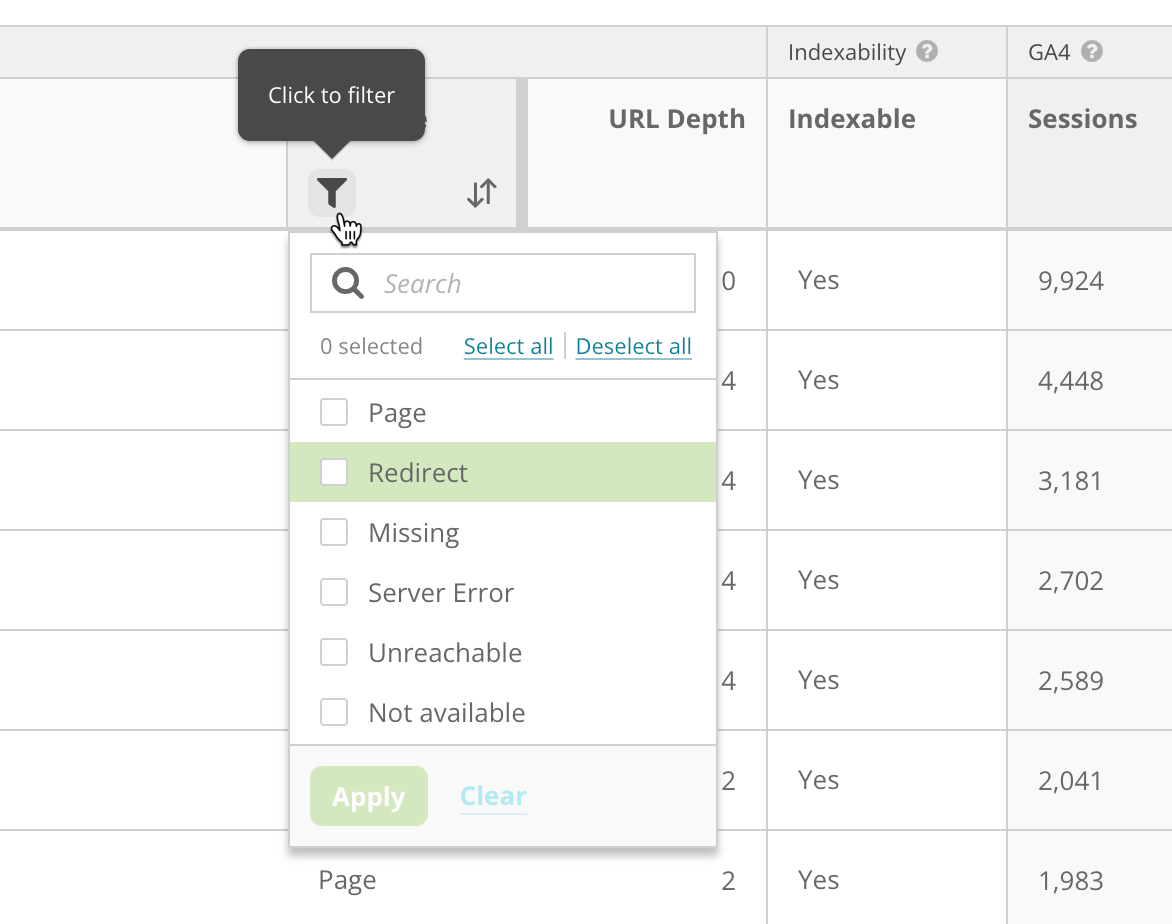
Column-level filters provide flexible ways to pinpoint exactly the data you want to see in the Pages table.
What counts as "best performing"? Keywords are sorted as follows:
* First, Google Search Console Impressions (if integrated)
* Rank (if tracked in Conductor)
* Monthly search volume
## Filter data flexibly
Column-level filters provide flexible ways to pinpoint exactly the data you want to see in the Pages table.
 ## Save and reuse workflows with Views
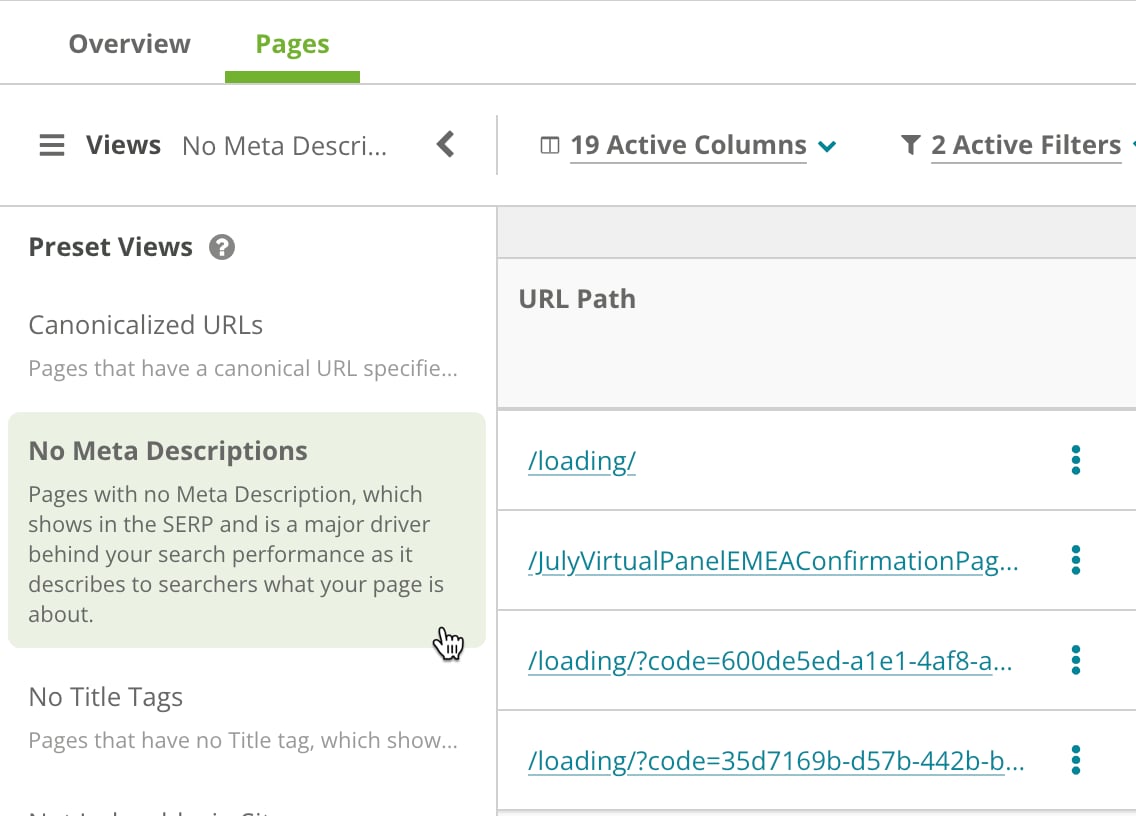
Quickly uncover valuable insights, based on our customers' most common use cases, by selecting a preset view. Or design your own view with any column and filter combination, save it, then share it with your team so it's ready to go.
## Save and reuse workflows with Views
Quickly uncover valuable insights, based on our customers' most common use cases, by selecting a preset view. Or design your own view with any column and filter combination, save it, then share it with your team so it's ready to go.
 ## Export data to multiple file types
Download your **Pages** table data to .XLSX or .csv. Conductor maintains the columns, filters, and sort orders you've applied to the table.
Up to 1 million rows are available to export. If you have more than 1 million rows in the table, Conductor exports the top million based on your current sorting and filtering choices.
Especially large files are generated and emailed to you. You'll be able to download them from the email when they are ready.
## Using Pages
* [Uncover opportunity by identifying underperforming content](https://app.conductor.com/u/community?ms_url=%2Fcourses%2Fa02cd5ee-d82e-41e8-b6f5-8bbd04830723%2Fstep%2F56bb5260-0d65-49cc-bbf9-57e1f39e903e)
* [Create a workspace to track your content's performance](https://app.conductor.com/u/community?ms_url=%2Fcourses%2Fcf5d38ef-6e33-4b47-84bd-1c2817f44b6b%2Fstep%2Ff176a566-4e97-42bb-8fce-d66676d9b056)
* [Building an executive report](https://app.conductor.com/u/community?ms_url=%2Fcourses%2Fcf5d38ef-6e33-4b47-84bd-1c2817f44b6b%2Fstep%2F248a95f8-49a9-4c6a-ac10-3d8be1aef9b1)
* [Track content changes using annotations](https://app.conductor.com/u/community?ms_url=%2Fcourses%2Fcf5d38ef-6e33-4b47-84bd-1c2817f44b6b%2Fstep%2F1cd66a14-71e6-4830-8415-066997c8cbdd)
* [Validate you are targeting the best variation of your keyword](https://app.conductor.com/u/community?ms_url=%2Fdocuments%2F27acc178-5178-4b2d-8ab9-97b8791a27bd)
* [Discover keywords to track with Conductor based on your high-value pages](https://app.conductor.com/u/community?ms_url=%2Fdocuments%2F27acc178-5178-4b2d-8ab9-97b8791a27bd)
* [Determine whether you were affected by a Google algorithm update](https://app.conductor.com/u/community?ms_url=%2Fdocuments%2Ffcef8ee5-fad1-460a-bd66-1829764ba48a)
## FAQs
[Review this feature's frequently asked questions](/docs/intelligence/pages-report-faqs/)
## Export data to multiple file types
Download your **Pages** table data to .XLSX or .csv. Conductor maintains the columns, filters, and sort orders you've applied to the table.
Up to 1 million rows are available to export. If you have more than 1 million rows in the table, Conductor exports the top million based on your current sorting and filtering choices.
Especially large files are generated and emailed to you. You'll be able to download them from the email when they are ready.
## Using Pages
* [Uncover opportunity by identifying underperforming content](https://app.conductor.com/u/community?ms_url=%2Fcourses%2Fa02cd5ee-d82e-41e8-b6f5-8bbd04830723%2Fstep%2F56bb5260-0d65-49cc-bbf9-57e1f39e903e)
* [Create a workspace to track your content's performance](https://app.conductor.com/u/community?ms_url=%2Fcourses%2Fcf5d38ef-6e33-4b47-84bd-1c2817f44b6b%2Fstep%2Ff176a566-4e97-42bb-8fce-d66676d9b056)
* [Building an executive report](https://app.conductor.com/u/community?ms_url=%2Fcourses%2Fcf5d38ef-6e33-4b47-84bd-1c2817f44b6b%2Fstep%2F248a95f8-49a9-4c6a-ac10-3d8be1aef9b1)
* [Track content changes using annotations](https://app.conductor.com/u/community?ms_url=%2Fcourses%2Fcf5d38ef-6e33-4b47-84bd-1c2817f44b6b%2Fstep%2F1cd66a14-71e6-4830-8415-066997c8cbdd)
* [Validate you are targeting the best variation of your keyword](https://app.conductor.com/u/community?ms_url=%2Fdocuments%2F27acc178-5178-4b2d-8ab9-97b8791a27bd)
* [Discover keywords to track with Conductor based on your high-value pages](https://app.conductor.com/u/community?ms_url=%2Fdocuments%2F27acc178-5178-4b2d-8ab9-97b8791a27bd)
* [Determine whether you were affected by a Google algorithm update](https://app.conductor.com/u/community?ms_url=%2Fdocuments%2Ffcef8ee5-fad1-460a-bd66-1829764ba48a)
## FAQs
[Review this feature's frequently asked questions](/docs/intelligence/pages-report-faqs/)