> ## Documentation Index
> Fetch the complete documentation index at: https://www.conductor.com/docs/llms.txt
> Use this file to discover all available pages before exploring further.
# Conductor Monitoring's Google Chrome Extension
> Conductor Monitoring aims to make your SEO processes as easy and efficient as possible, and our Chrome extension really nails that.
Conductor Monitoring aims to make your SEO processes as easy and efficient as possible, and our Chrome extension really nails that.
Want to try it out immediately? 👉 [Install the extension right now](https://chrome.google.com/webstore/detail/contentking-real-time-seo/kelobidgacbngfmplnjckcbgpkplnbnd) (takes 10 seconds, literally!)
### Note!
Conductor also has an extension for our Conductor Intelligence product. This article is about Conductor Monitoring's Google Chrome extension. If you are looking for information about our Conductor Intelligence extension, you can find it [in this article](/docs/platform/conductor-for-google-chrome-conductors-enterprise-seo-chrome-extension/).
## The right data at your fingertips
The Conductor Monitoring Chrome extension allows you to view Conductor Monitoring metrics and data about your websites directly in your browser.
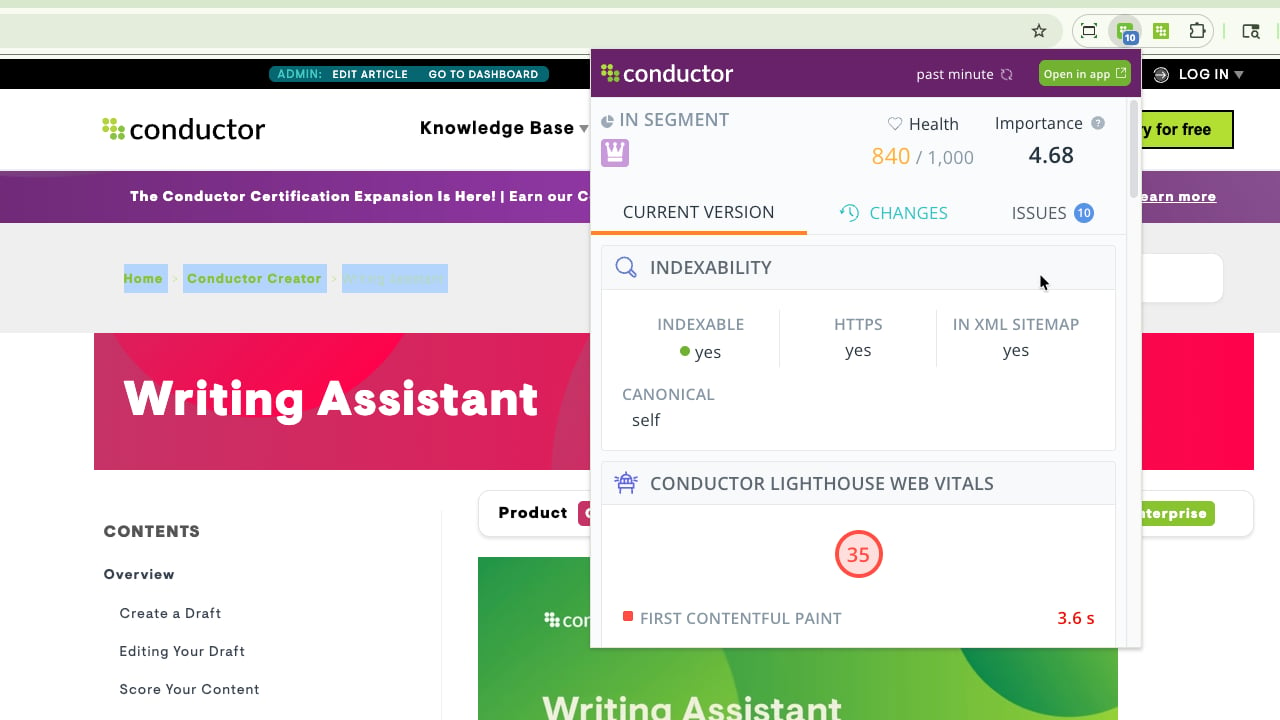 When browsing a website that is being monitored by Conductor Monitoring, you can easily view all Conductor Monitoring data about the page you are currently visiting.
### Note
The Conductor Monitoring Chrome extension provides you with the following data:
* SEO metrics
* Segments, Page Health, and Importance
* Indexability (HTTPS, In XML sitemap, Canonical)
* Content (Page Title, Meta Description, Headings)
* Google Analytics & Google Search Console data
* Custom Elements
* Social markup (Open Graph, Twitter Cards)
* Tracked Changes
* Issues
### SEO metrics
The extension consists of three tabs: **Current Version**, **Changes**, and **Issues**.
When browsing a website that is being monitored by Conductor Monitoring, you can easily view all Conductor Monitoring data about the page you are currently visiting.
### Note
The Conductor Monitoring Chrome extension provides you with the following data:
* SEO metrics
* Segments, Page Health, and Importance
* Indexability (HTTPS, In XML sitemap, Canonical)
* Content (Page Title, Meta Description, Headings)
* Google Analytics & Google Search Console data
* Custom Elements
* Social markup (Open Graph, Twitter Cards)
* Tracked Changes
* Issues
### SEO metrics
The extension consists of three tabs: **Current Version**, **Changes**, and **Issues**.
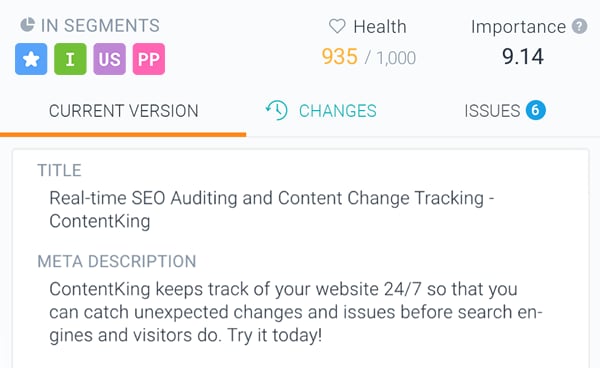 When you open the extension on any monitored page, first you will see the **Current Version** tab which contains all the above-listed SEO metrics about the particular page.
The data displayed in the **Current Version** tab is always real-time, as Conductor Monitoring crawls the page immediately when you visit it in your browser.
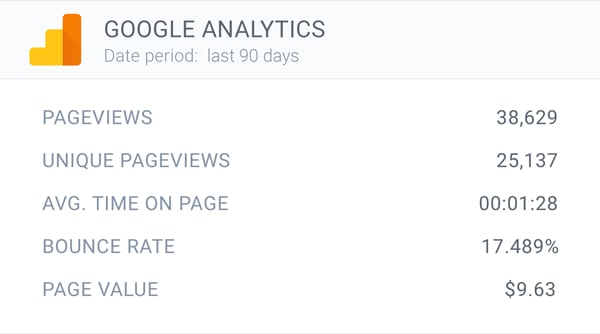
So for example, if you want to view Google Analytics data about the page you are currently browsing, just scroll down in the **Current Version** tab:
When you open the extension on any monitored page, first you will see the **Current Version** tab which contains all the above-listed SEO metrics about the particular page.
The data displayed in the **Current Version** tab is always real-time, as Conductor Monitoring crawls the page immediately when you visit it in your browser.
So for example, if you want to view Google Analytics data about the page you are currently browsing, just scroll down in the **Current Version** tab:
 ### Tracked Changes
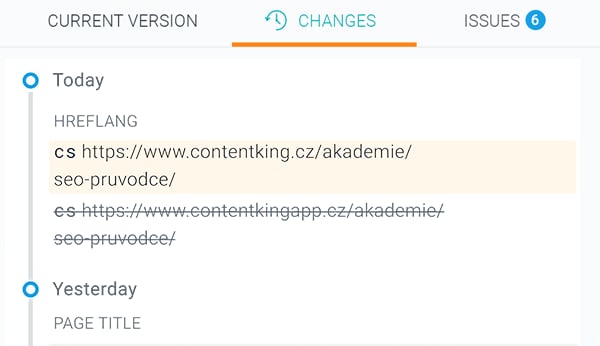
The extension allows you to view the full history of changes for every monitored page. You will always find all the tracked changes in the **Changes** tab.
### Tracked Changes
The extension allows you to view the full history of changes for every monitored page. You will always find all the tracked changes in the **Changes** tab.
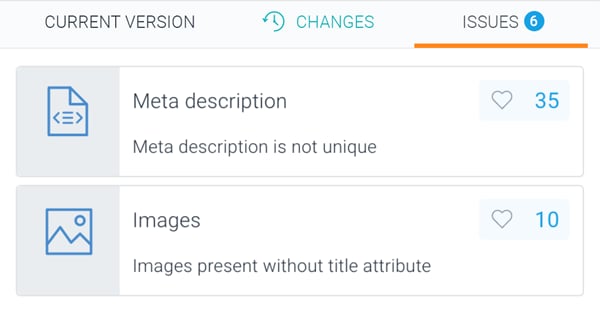
 ### Issues
If you want to get a quick overview of all SEO issues that Conductor Monitoring is detecting on a page, just open the extension and go to the **Issues** tab, where you will always find all SEO issues of the page as well as the impact of these Issues on the Page Health.
### Issues
If you want to get a quick overview of all SEO issues that Conductor Monitoring is detecting on a page, just open the extension and go to the **Issues** tab, where you will always find all SEO issues of the page as well as the impact of these Issues on the Page Health.
 ## Jump to Conductor Monitoring with one click
Do you need more information about the page you’re visiting?
No problem! Just click the **Open in App** button and jump directly to the **Page Detail** screen in Conductor Monitoring.
## Jump to Conductor Monitoring with one click
Do you need more information about the page you’re visiting?
No problem! Just click the **Open in App** button and jump directly to the **Page Detail** screen in Conductor Monitoring.
 ## The extension icon
If you want to quickly check whether a page is indexable or not, you don’t even need to open the extension. Just look at the color of the extension icon:
* If the icon is green, the page is indexable.
* If the icon is orange, the page is non-indexable. For more information just check the **Why?** button in the **Indexability** section of the **Current Version** tab.
The blue badge next to the extension icon shows you how many Issues Conductor Monitoring is detecting on the page.
## How to get started
1. [Log in](https://app.cm.conductor.com/login) to your Conductor Monitoring account, or [start a free 14-day trial](https://conductor.com/free-trial/).
2. Install the Conductor Monitoring Chrome extension to your browser in [Chrome Store](https://chrome.google.com/webstore/detail/contentking-real-time-seo/kelobidgacbngfmplnjckcbgpkplnbnd).
3. Open any page on a website that is monitored by Conductor Monitoring.
4. Click the extension icon in your browser's toolbar.
## Permissions and Privacy
When adding the extension to Chrome, you will be asked for the following permissions:
* **Read and change your data on data.com.conductor.com and technical-data.app.conductor.com.**
* **Read your browsing history**
Our extension needs these permissions because when visiting websites the extension needs to check whether the website is being monitored from your Conductor Monitoring account, so that it can request the data for the particular page you’re on.
If the website you are visiting isn’t monitored from your Conductor Monitoring account, the extension will be inactive.
Furthermore, all data processed by the extension is protected according to our [Privacy Policy](https://www.conductor.com/legal/privacy-policy/).
## Do you need help?
If you’re having trouble getting started with the Conductor Monitoring Chrome extension, don’t hesitate to [contact us](mailto:support@conductor.com)!
## The extension icon
If you want to quickly check whether a page is indexable or not, you don’t even need to open the extension. Just look at the color of the extension icon:
* If the icon is green, the page is indexable.
* If the icon is orange, the page is non-indexable. For more information just check the **Why?** button in the **Indexability** section of the **Current Version** tab.
The blue badge next to the extension icon shows you how many Issues Conductor Monitoring is detecting on the page.
## How to get started
1. [Log in](https://app.cm.conductor.com/login) to your Conductor Monitoring account, or [start a free 14-day trial](https://conductor.com/free-trial/).
2. Install the Conductor Monitoring Chrome extension to your browser in [Chrome Store](https://chrome.google.com/webstore/detail/contentking-real-time-seo/kelobidgacbngfmplnjckcbgpkplnbnd).
3. Open any page on a website that is monitored by Conductor Monitoring.
4. Click the extension icon in your browser's toolbar.
## Permissions and Privacy
When adding the extension to Chrome, you will be asked for the following permissions:
* **Read and change your data on data.com.conductor.com and technical-data.app.conductor.com.**
* **Read your browsing history**
Our extension needs these permissions because when visiting websites the extension needs to check whether the website is being monitored from your Conductor Monitoring account, so that it can request the data for the particular page you’re on.
If the website you are visiting isn’t monitored from your Conductor Monitoring account, the extension will be inactive.
Furthermore, all data processed by the extension is protected according to our [Privacy Policy](https://www.conductor.com/legal/privacy-policy/).
## Do you need help?
If you’re having trouble getting started with the Conductor Monitoring Chrome extension, don’t hesitate to [contact us](mailto:support@conductor.com)!