> ## Documentation Index
> Fetch the complete documentation index at: https://www.conductor.com/docs/llms.txt
> Use this file to discover all available pages before exploring further.
# Log File Analysis
> Analyze how search engines and AI crawlers traverse your site by ingesting your server log files into Conductor Monitoring.
With Conductor Monitoring’s **Log File Analysis** feature, you can easily understand how search engine crawlers traverse the content on your website. Discover when **Google**, **Bing**, **OpenAI**, or **Perplexity** last visited each page, and compare visit frequencies between pages.
## What is Log File Analysis?
A log file is a text file containing records of all the requests a server has received, from both humans and crawlers, and its responses to the requesters.
Through log file analysis, AEO and SEO professionals can get a better understanding of what search engines are actually doing on their websites, in order to improve their performance.
### Useful resources
[Log File Analysis for SEO: An Introduction](https://www.conductor.com/academy/log-file-analysis/)
## Log Sources
Currently you can feed your logs to Conductor Monitoring using any of the following CDN platforms:
* [Cloudflare Worker](https://developers.cloudflare.com/workers/learning/how-workers-works)
* [Cloudflare Logpush](https://developers.cloudflare.com/logs/about/)
* [Akamai DataStream](https://techdocs.akamai.com/datastream2/docs)
* [CloudFront Standard logging](https://docs.aws.amazon.com/AmazonCloudFront/latest/DeveloperGuide/AccessLogs.html)
* [Fastly Real-Time Log Streaming](https://docs.fastly.com/en/guides/about-fastlys-realtime-log-streaming-features)
### Can I integrate a data aggregation platform like Splunk instead?
No, currently Conductor Monitoring supports only direct integrations with the CDNs listed above.
## Traffic that Conductor Monitoring detects and tracks
Conductor Monitoring detects and tracks visits of the following search engines to your websites:
* Google Desktop
* Google Mobile
* Bing Desktop
* Bing Mobile
* OpenAI (OAI-SearchBot, ChatGPT-User, and GPTBot)
* Perplexity (PerplexityBot and Perplexity-User)
You can learn more about these engines' crawlers in our [Log File Analysis FAQs](/docs/monitoring/log-file-analysis-faqs/) article.
## Setting up the Log File Analysis
The process of configuring the Log File Analysis differs based on the log sources that are used to feed them to Conductor Monitoring. Refer to the relevant support article based on your website's log source:
1. [Setting up the Cloudflare Worker integration](/docs/monitoring/setting-up-the-cloudflare-worker-integration/)
2. [Setting up the Cloudflare Logpush integration](/docs/monitoring/setting-up-the-cloudflare-logpush-integration/)
3. [Setting up the Akamai integration](/docs/monitoring/setting-up-the-akamai-integration/)
4. [Setting up CloudFront Standard logging](/docs/monitoring/setting-up-the-cloudfront-integration/)
5. [Setting up Fastly Real-Time Log Streaming](/docs/monitoring/setting-up-the-fastly-integration/)
## Working with the Log File Analysis data in Conductor Monitoring
### Using the Log File Analysis data in Pages
Search engines will have two columns each on the Pages screen: **Last Visited** and **Visit Frequency**, which you can use for filtering:
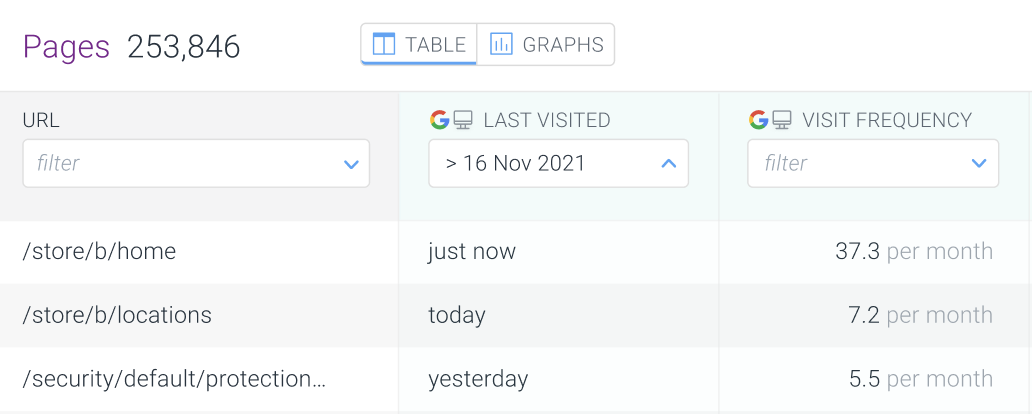 When filtering on the columns, you can easily create [segments](/docs/monitoring/segments/) which can be very useful to do spot checks of your least visited pages.
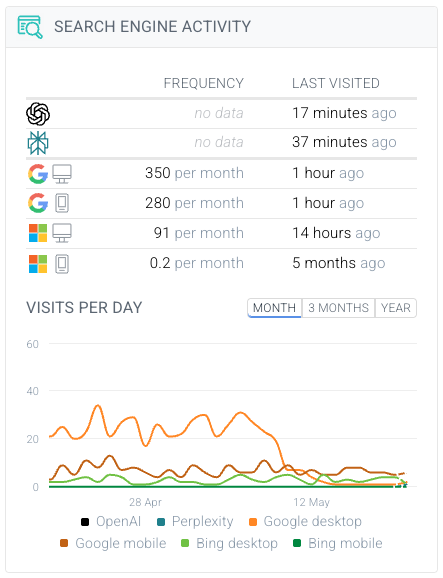
On the Page Detail screen, you can zoom in on how often crawlers are visiting a specific page. With a neat graph you can identify any trends in the search engine traffic on that page:
When filtering on the columns, you can easily create [segments](/docs/monitoring/segments/) which can be very useful to do spot checks of your least visited pages.
On the Page Detail screen, you can zoom in on how often crawlers are visiting a specific page. With a neat graph you can identify any trends in the search engine traffic on that page:
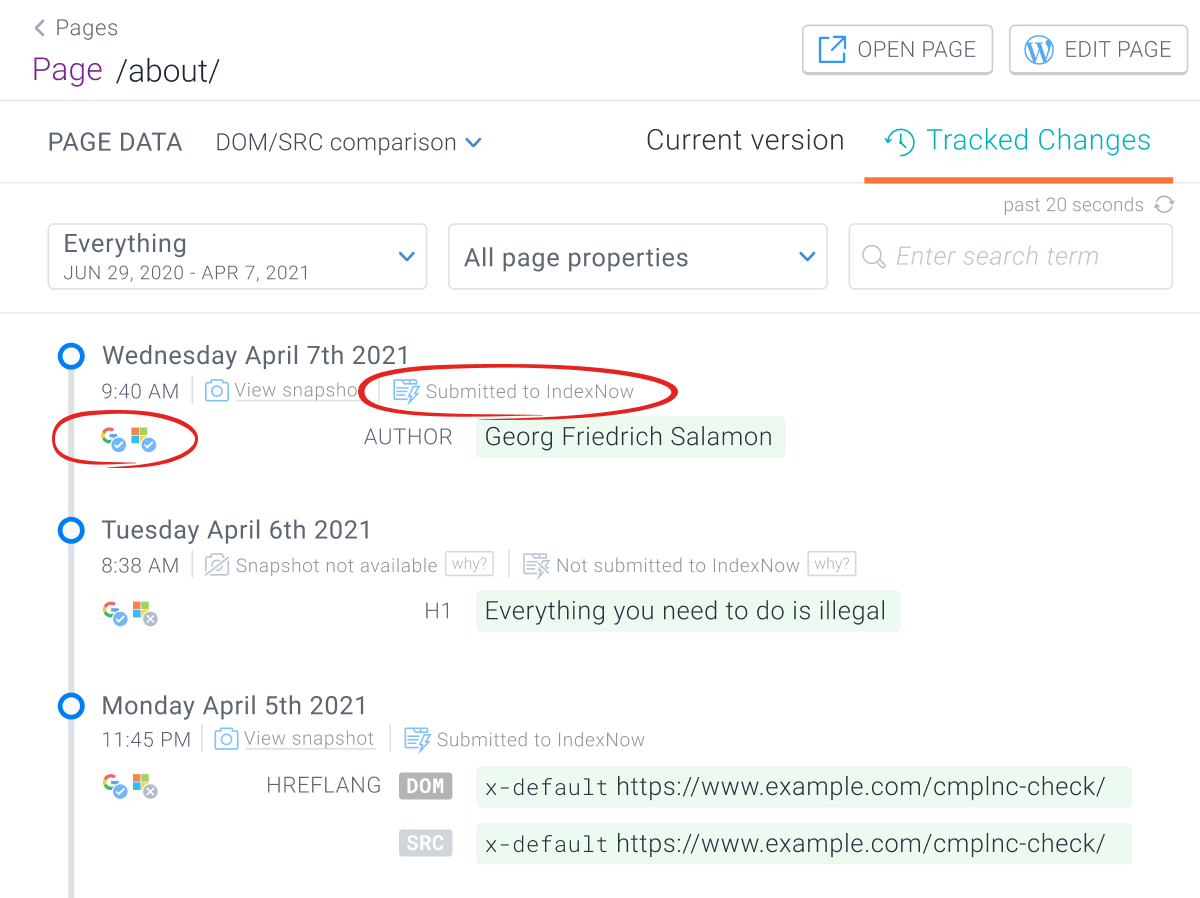
 And in the **Tracked Changes** tab of the **Page Detail** screen, you will be able to see whether search engines saw the latest important change that you’ve made.
In combination with our [Real-Time IndexNow](/docs/monitoring/real-time-indexnow/) feature you can see if Bing visited the page that was submitted to IndexNow:
And in the **Tracked Changes** tab of the **Page Detail** screen, you will be able to see whether search engines saw the latest important change that you’ve made.
In combination with our [Real-Time IndexNow](/docs/monitoring/real-time-indexnow/) feature you can see if Bing visited the page that was submitted to IndexNow:
 ### Log File Analysis data in the Platform section
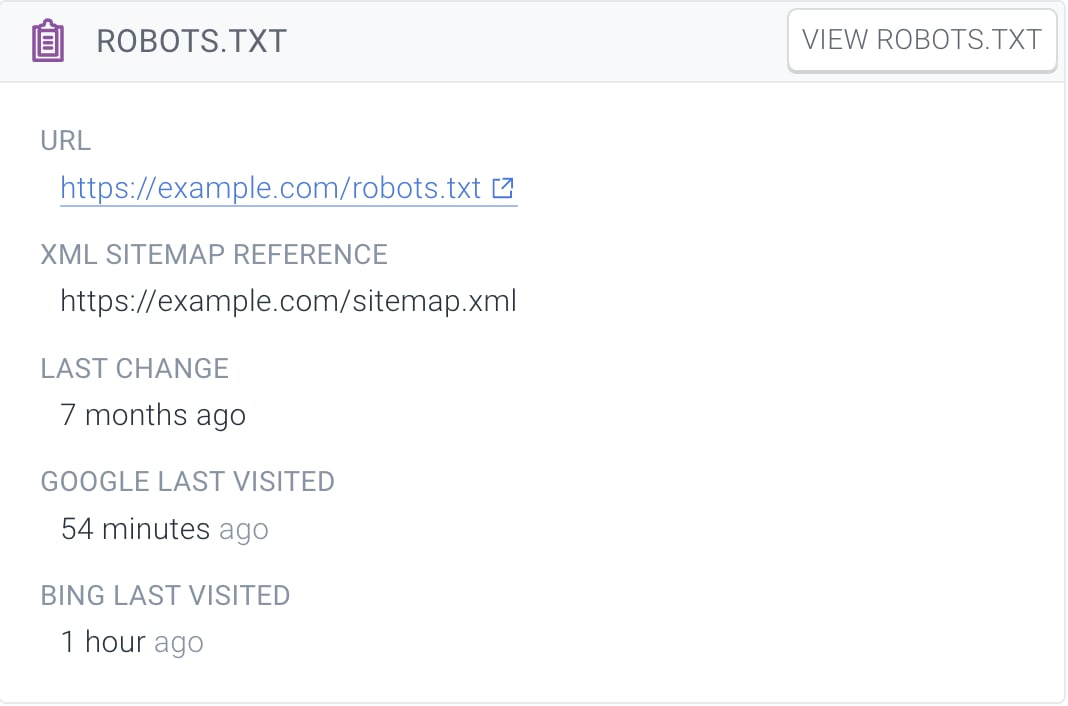
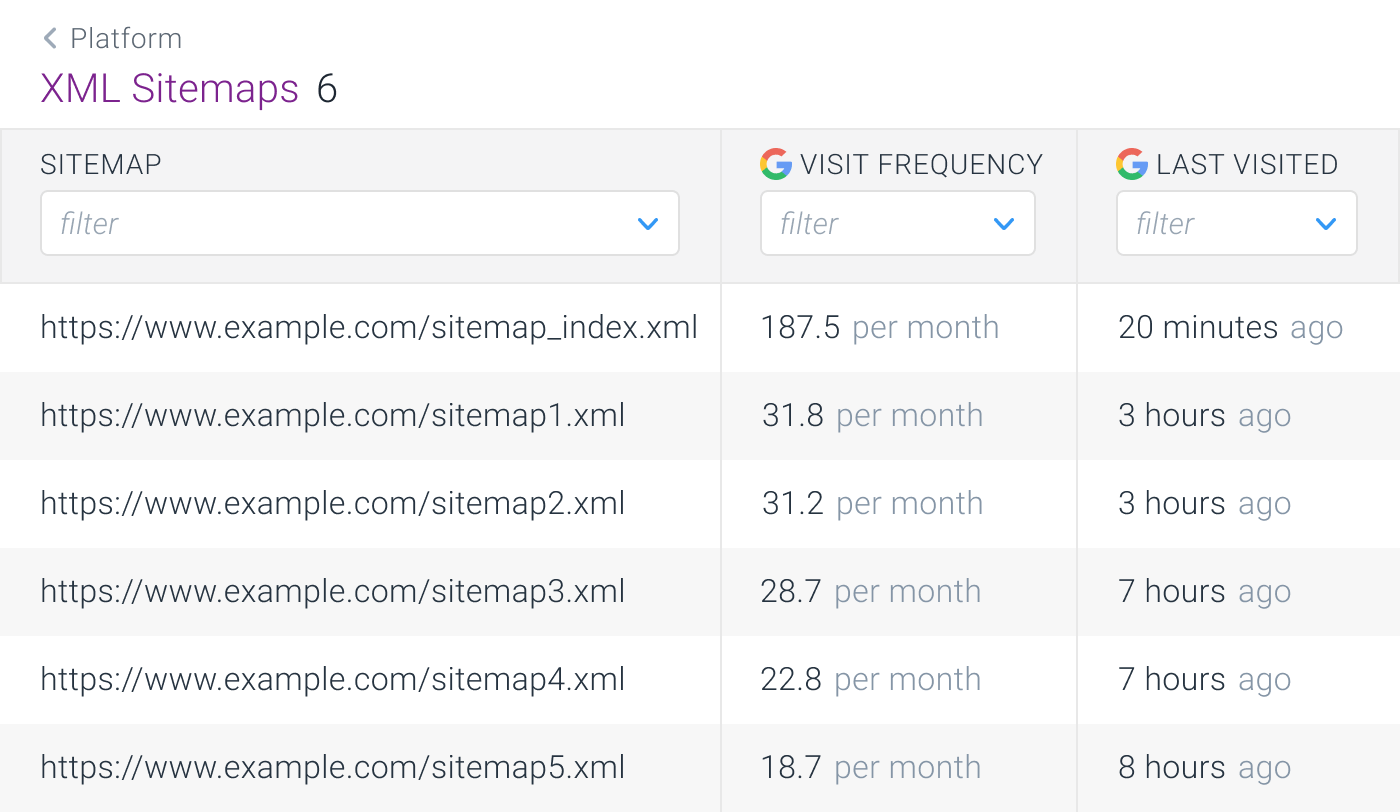
If you have made some changes to the robots.txt file or the XML sitemaps and you want to check if search engines visited them since, just head to the Platform section in Conductor Monitoring and easily check if the search engines visited the robots.txt:
### Log File Analysis data in the Platform section
If you have made some changes to the robots.txt file or the XML sitemaps and you want to check if search engines visited them since, just head to the Platform section in Conductor Monitoring and easily check if the search engines visited the robots.txt:
 Or the XML sitemaps:
 ## Disabling Log File Analysis
To learn how to disable Log File Analysis please refer to the relevant support article based on your website’s log source:
* [Akamai DataStream](/docs/monitoring/setting-up-the-akamai-integration/)
* [Cloudflare Worker](/docs/monitoring/setting-up-the-cloudflare-worker-integration/)
* [Cloudflare Logpush](/docs/monitoring/setting-up-the-cloudflare-logpush-integration/)
* [CloudFront Standard logging](/docs/monitoring/setting-up-the-cloudfront-integration/)
* [Fastly Real-Time Log Streaming](/docs/monitoring/setting-up-the-fastly-integration/)
## Using Log File Analysis
Curious why (and how) you can use Log File Analysis to inform your content strategy in the world of AI search? Check our [AI Crawler Activity in Conductor Monitoring](https://app.conductor.com/u/community?ms_url=%2Fdocuments%2F858fb972-2963-4f86-966c-c9f5cec4b811) guide to learn!
## FAQs
[Review this feature's frequently asked questions](/docs/monitoring/log-file-analysis-faqs/)
## Disabling Log File Analysis
To learn how to disable Log File Analysis please refer to the relevant support article based on your website’s log source:
* [Akamai DataStream](/docs/monitoring/setting-up-the-akamai-integration/)
* [Cloudflare Worker](/docs/monitoring/setting-up-the-cloudflare-worker-integration/)
* [Cloudflare Logpush](/docs/monitoring/setting-up-the-cloudflare-logpush-integration/)
* [CloudFront Standard logging](/docs/monitoring/setting-up-the-cloudfront-integration/)
* [Fastly Real-Time Log Streaming](/docs/monitoring/setting-up-the-fastly-integration/)
## Using Log File Analysis
Curious why (and how) you can use Log File Analysis to inform your content strategy in the world of AI search? Check our [AI Crawler Activity in Conductor Monitoring](https://app.conductor.com/u/community?ms_url=%2Fdocuments%2F858fb972-2963-4f86-966c-c9f5cec4b811) guide to learn!
## FAQs
[Review this feature's frequently asked questions](/docs/monitoring/log-file-analysis-faqs/)