
Metrics
For every page, Conductor Monitoring monitors the following Web Vitals metrics:- Performance
- First Contentful Paint
- Time to Interactive
- Speed Index
- Total Blocking Time
- Largest Contentful Paint
- Cumulative Layout Shift
Working with the Web Vitals metrics in Conductor Monitoring
Once enabled, you can work with the Web Vitals metrics across the whole platform, same as with the other page properties and metrics Conductor Monitoring is monitoring.Using the Web Vitals data in Pages
Each Web Vital has its own dedicated column on the Pages screen which you can use for filtering: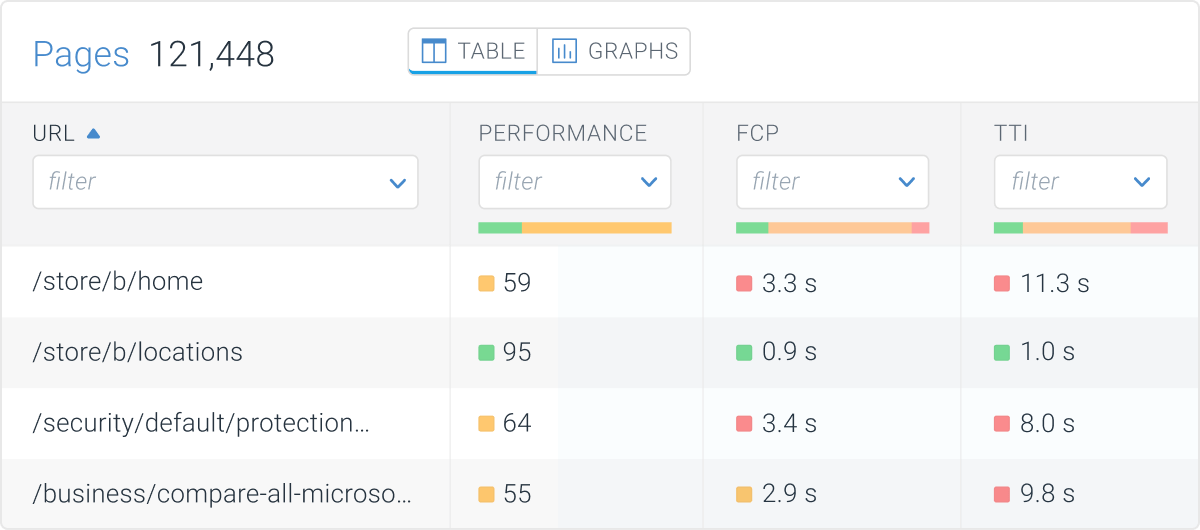
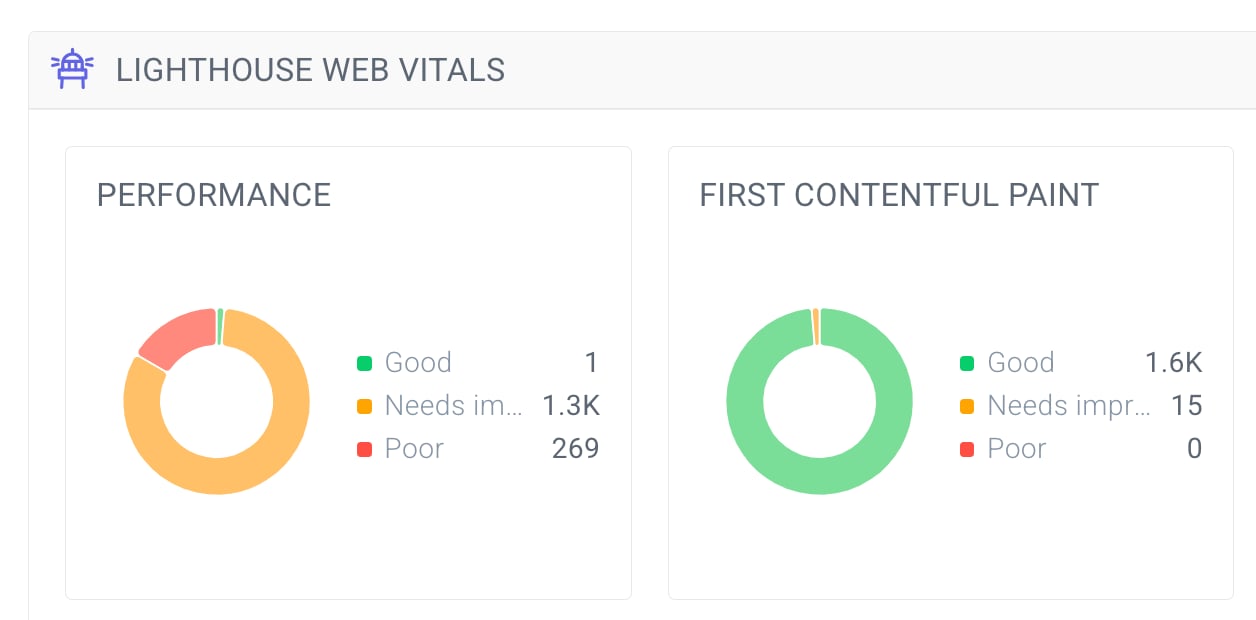
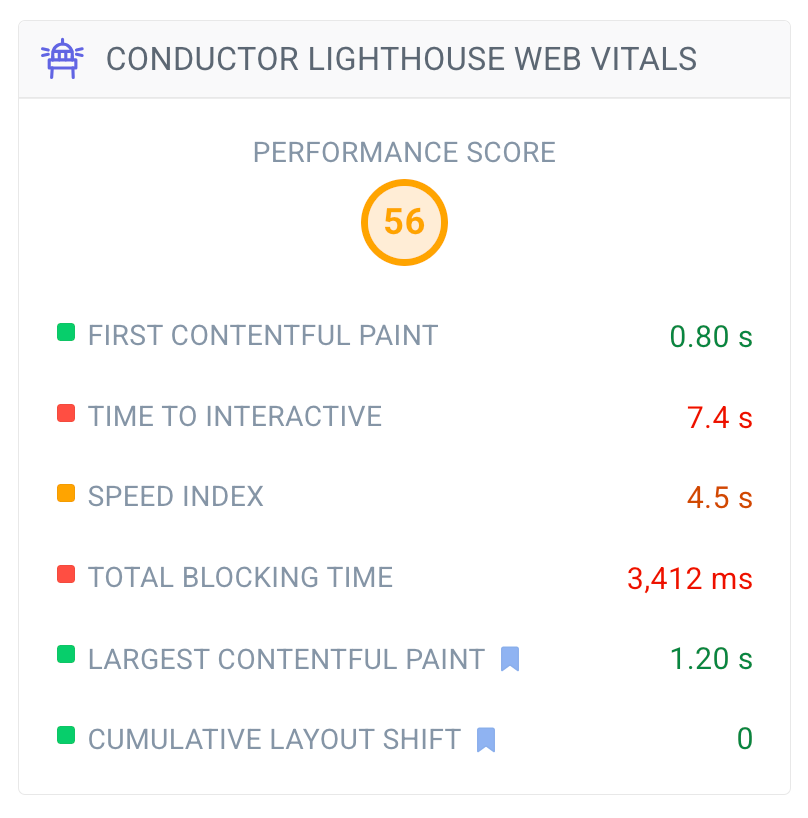
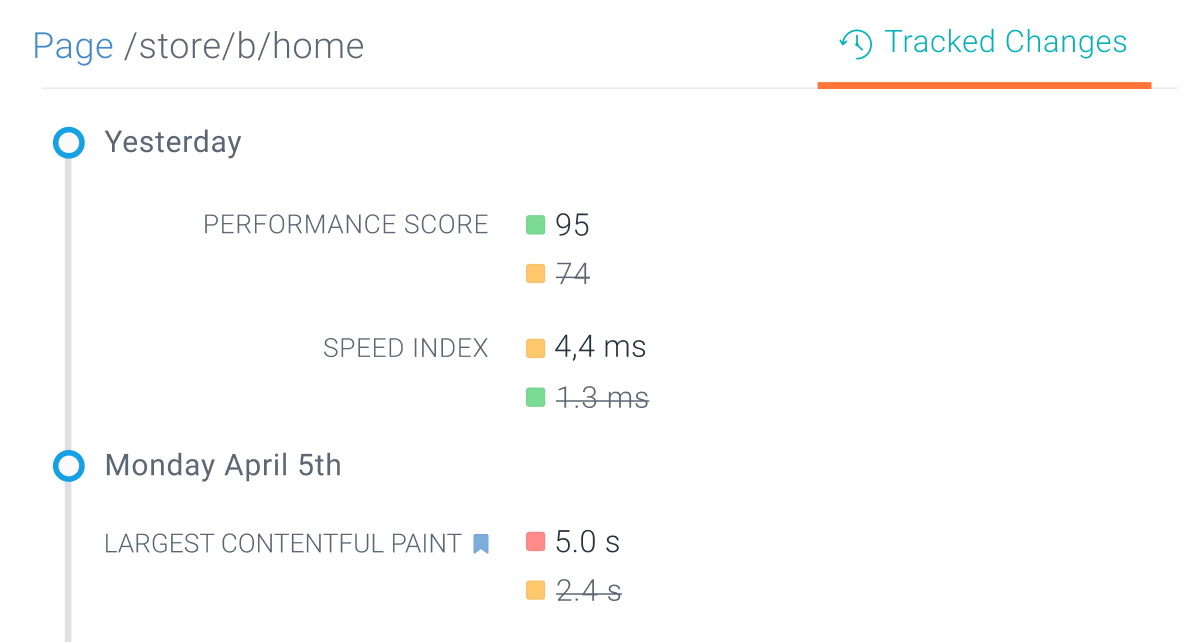
Using the Web Vitals data in Issues
The Conductor Monitoring Lighthouse Web Vitals have a dedicated category in the Issues section. In the issue category, the Web Vitals metrics are being audited separately on each page as well as on the whole website overall: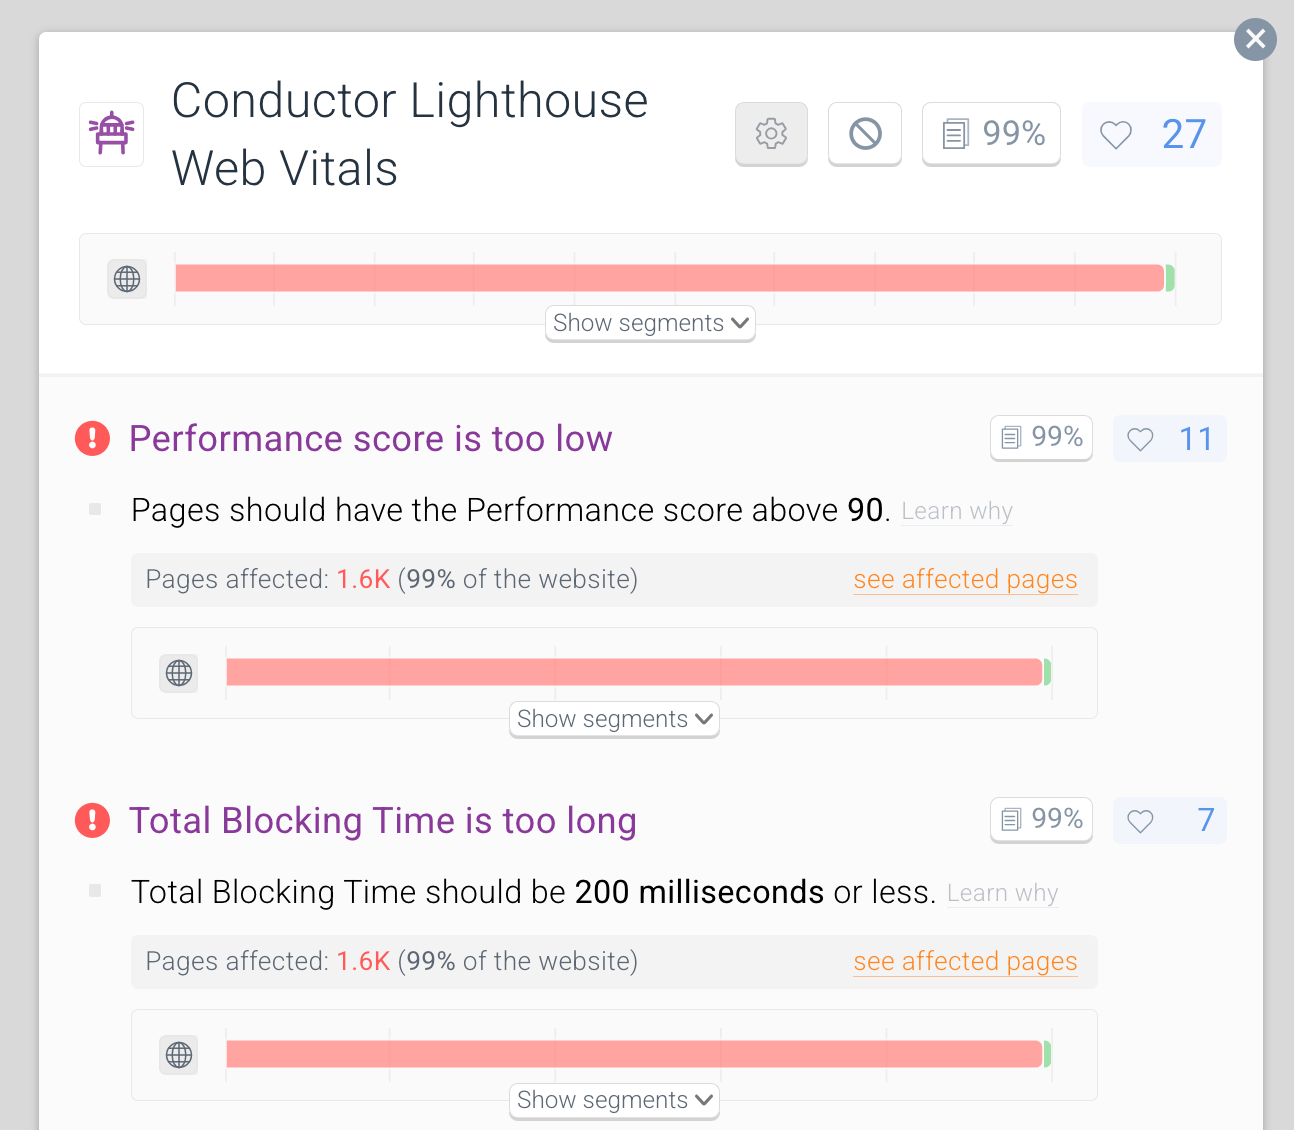
Using the Web Vitals data in Alerts
Conductor Monitoring will proactively alert you when your pages’ Performance score or any of the other Web Vitals drop below good.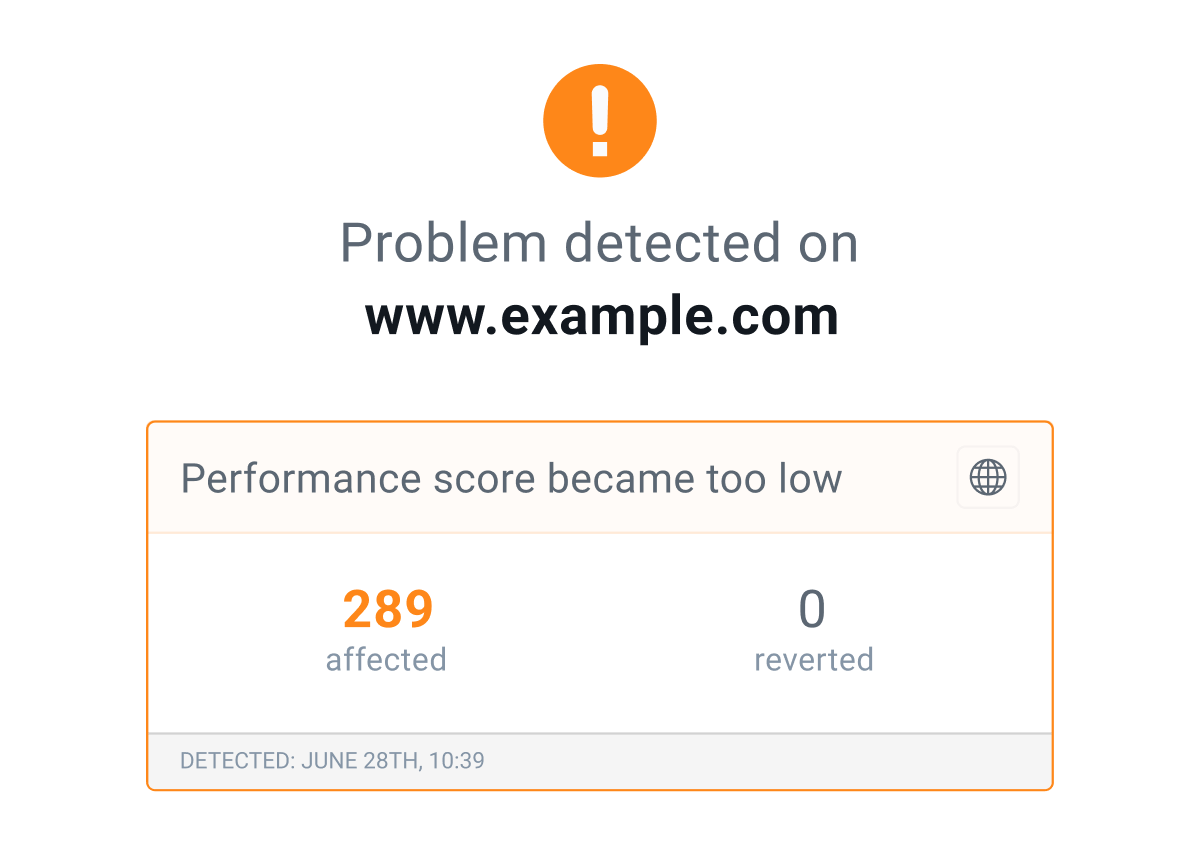
Enabling the Lighthouse Web Vitals Monitoring
To enable the Conductor Monitoring Web Vitals Lighthouse Monitoring feature, follow these steps:- Follow the path Settings > Monitoring.
- In the top right corner of the JavaScript Rendering section, click Edit.
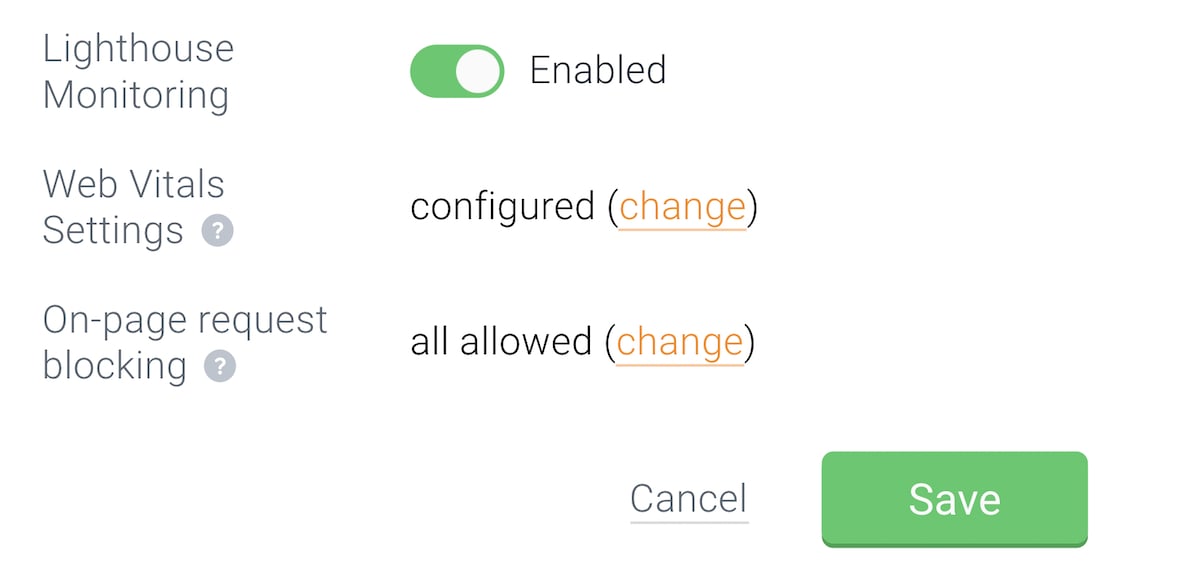
- Enable Lighthouse Monitoring using the toggle.
- After enabling the toggle, configure the Web Vitals settings and custom on-page request blocking if needed (more about this below).
- Click Save.
It can initially take up to a few hours before the Web Vitals metrics are first calculated for all of your pages.
Custom on-page request blocking
To be able to measure and monitor your website’s Web Vitals, Conductor Monitoring needs to render JavaScript on your pages. This means that after enabling the Lighthouse Monitoring feature, Conductor Monitoring will start executing JavaScript when monitoring the website (unless you have the JavaScript Rendering feature already enabled, in which case Conductor Monitoring is already executing JavaScript). When rendering a website, Conductor Monitoring blocks requests to the most common web analytics and ad services to ensure that your web analytics data don’t get inflated by Conductor Monitoring’s monitoring. This means that if you’re using a common JavaScript-based web analytics solution such as Google Analytics or Adobe Analytics, Conductor Monitoring’s monitoring does not have any effect on your web analytics data. If you’re using a non-standard web analytics solution and you want to ensure that Conductor Monitoring’s monitoring doesn’t affect your analytics data, make sure to configure custom on-page request blocking in Conductor Monitoring. To configure custom on-page request blocking, follow these steps:- Follow the path Settings > Monitoring.
- In the top-right corner of the JavaScript Rendering section, click Edit, and then click change next to the On-page request blocking setting.
- In the window that appears, choose whether you want to use a deny-list (Allow all except) or an allow-list (Deny all except) to configure the request blocking.
- Define which requests will be allowed or denied using the Operator (more about the operators here) and the URL Pattern.
- Click Apply changes.
Web Vitals Settings
The Web Vitals Settings section allows you to customize the Needs improvement and Poor thresholds for the individual Web Vitals. By default, Conductor Monitoring uses the same thresholds as Google’s PageSpeed Insights report. This means that if you want Conductor Monitoring to audit your website’s Web Vitals the same way as Google, there’s no need to change these settings. However, you have the option to customize the thresholds according to your specific needs and use-cases: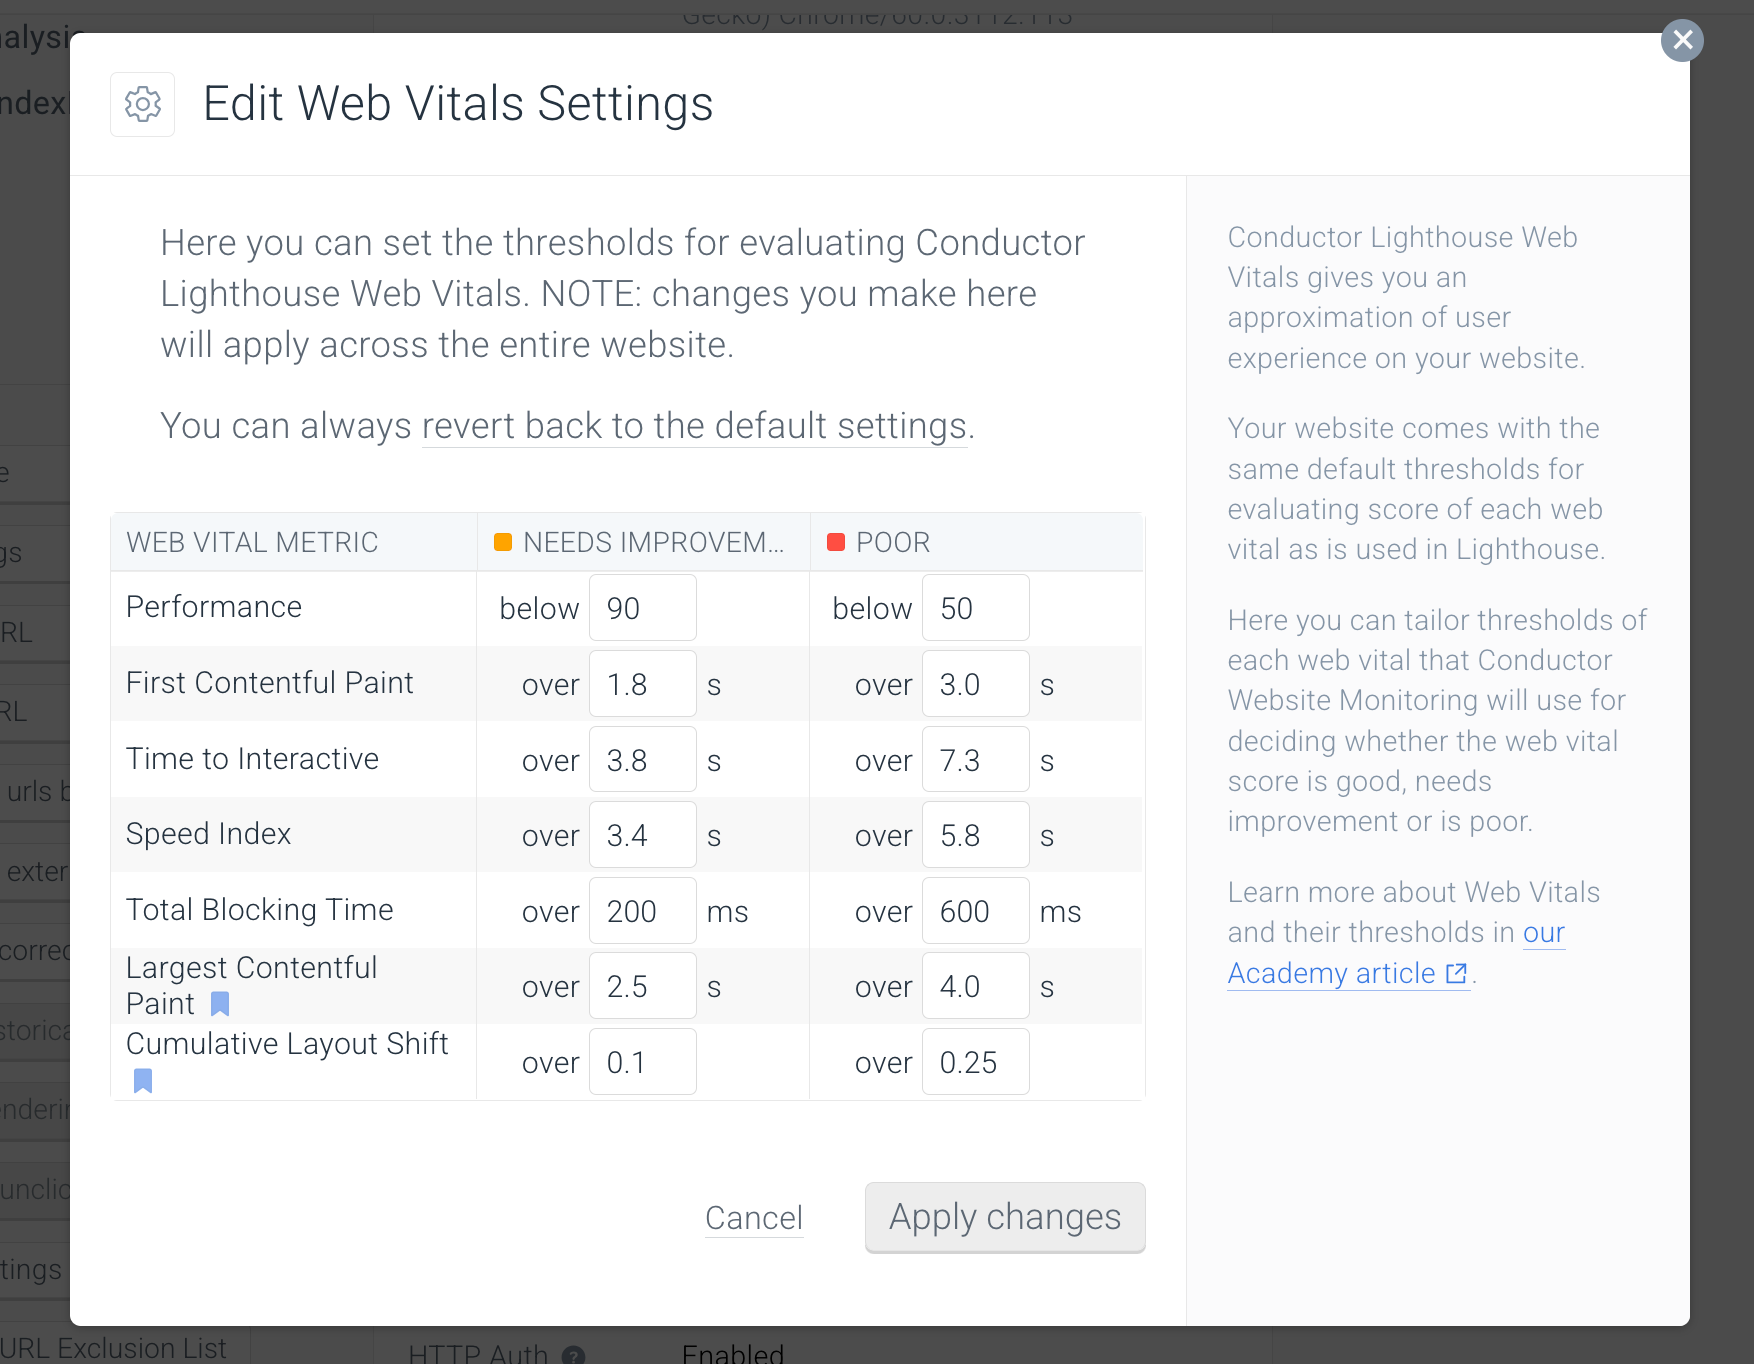
Lighthouse Monitoring and JavaScript Rendering
To be able to measure and monitor your website’s Web Vitals, Conductor Monitoring needs to render JavaScript on your pages. This means that after enabling the Lighthouse Monitoring feature Conductor Monitoring will start executing JavaScript on the website and will render the pages in full, including assets like images and videos.Due to this, enabling this feature on a website can lead to an increase in data traffic between Conductor Monitoring and the web server.
- Audit using JS Rendering
- Lighthouse Monitoring
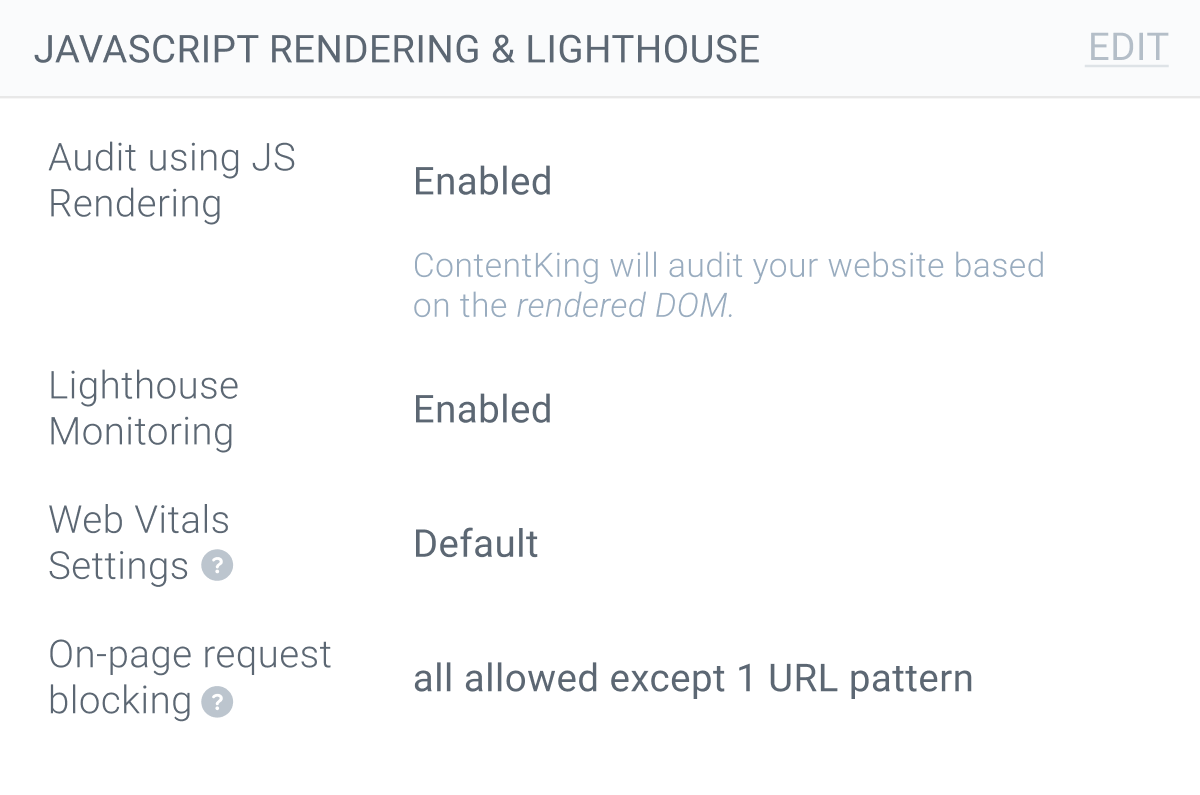
- Conductor Monitoring will be executing JavaScript, and the rendered DOM will be considered the primary source of data about the website
- Conductor Monitoring will also measure and monitor the Lighthouse metrics about the website
- Conductor Monitoring will not execute JavaScript, and the HTML source code will be considered the primary source of data about the website
- Conductor Monitoring will also not measure and monitor the Lighthouse metrics about the website
- Conductor Monitoring will be executing JavaScript, and the rendered DOM will be considered the primary source of data about the website
- Conductor Monitoring will not measure and monitor the Lighthouse metrics about the website
- Conductor Monitoring will be executing JavaScript for the purpose of measuring the Lighthouse metrics
- The HTML source code will still be considered the primary source of data about the website
Why do the Conductor Monitoring Lighthouse metrics differ from the PageSpeed Insights report?
In some cases you might see that the values of the Lighthouse Web Vitals metrics reported by Conductor Monitoring for your pages are different from Google’s PageSpeed Insights report. This is because Conductor Monitoring’s Lighthouse Monitoring feature works with the so-called lab data. As opposed to the field data, which Google collects from real users, lab data is collected within a controlled environment with a predefined device and network connection settings, without any involvement from real users. The field data can only be obtained one way: by measuring how real-world users interact with your website. The lab data, on the other hand, is collected by simulating real users and can therefore be obtained in multiple ways:- The Lab data report in Google’s PageSpeed Insights
- Monitoring solutions like Conductor Monitoring
- Locally on your device using Chrome DevTools
Field data vs. Lab data summarized
You can read more about the difference between field data and lab data in our Academy article.
Factors influencing the lab data
As seen above, the lab data is collected from a specific environment (device) with a specific configuration (parameters), which influences the resulting metrics. These parameters include:- Device type
- Location
- Network throttling
- CPU performance
- Lighthouse and Chrome versions
Device type
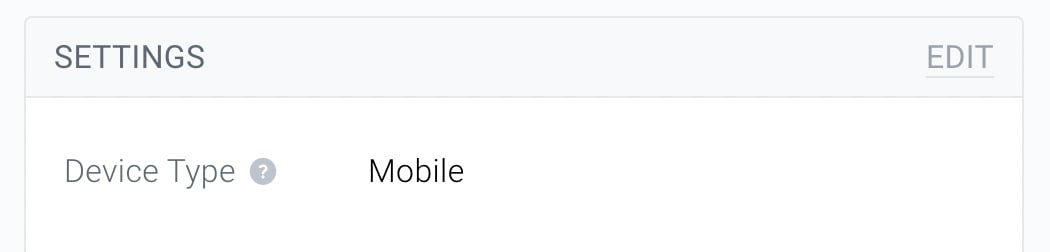
Same as Google’s PageSpeed Insights report, Conductor Monitoring simulates a mid-tier device (Moto G4) when measuring your website’s Lighthouse metrics. Conductor Monitoring also supports two different Device Types (viewports):- Mobile (width 360px, height 640px)
- Desktop (width 1,350px, height 940px)
Location
The location from which Conductor Monitoring monitors your website in relation with the location of the server on which your website is hosted has an impact on the Lighthouse metrics measured. For example: if you live in the US, browsing a website hosted on a US-based server will be faster than browsing a website hosted on a server located in the UK. The reason for this is that in the latter case the data must travel much further – from the server in the UK to your phone or laptop in the US. Google’s PageSpeed Insights chooses the test location dynamically based on your current location. So if you are running a PageSpeed Insights test from the US, Google will also measure the metrics from their US server, etc. Conductor Monitoring supports three monitoring locations out of the box:- US
- UK
- EU (The Netherlands)
Network Throttling
When visiting a website in your browser, the speed of your internet connection is one of the major factors that determine how fast the website loads. When calculating the Lighthouse metrics for your website, Conductor Monitoring automatically throttles the internet connection to make the results reflect the average user as closely as possible.CPU performance
When a website uses a lot of JavaScript-based content which relies on your browser to be executed and loaded, a device with a higher CPU performance will be able to load the page faster than a device with a lower CPU performance. This also influences the Lighthouse metrics, as different devices which are being used to visit your website have different CPU performances.Lighthouse and Chrome versions
Conductor Monitoring uses the latest version of Lighthouse, and the Chrome version recommended by the Lighthouse documentation as a best practice for the given Lighthouse version:- Lighthouse v9
- Chrome v110