The Keywords report provides you with holistic, aggregated keyword reporting. You can find high-level information for your keywords and sort along a number of different dimensions to help you learn how your tracked keywords perform.
The Keywords report includes four tabs:
- Overview includes the Visibility Over Time and Seasonality charts for a trended view of your websites’ search performance and your keywords’ search demand, plus the Result types chart and the Top locations and Top keyword groups widgets, which break your performance down by result type, location, and keyword group.
- Competitive landscape shows how your website’s share of rankings compares to the other websites ranking for your tracked keywords, including the pages that rank most often and the keyword groups where competitors lead. From here, you can also open Competitor comparison to compare ranks keyword by keyword with up to five competitors.
- Engagement brings in your Google Search Console impressions, clicks, click-through rate (CTR), and average position, so you can see what you’re found for in search and whether searchers click through.
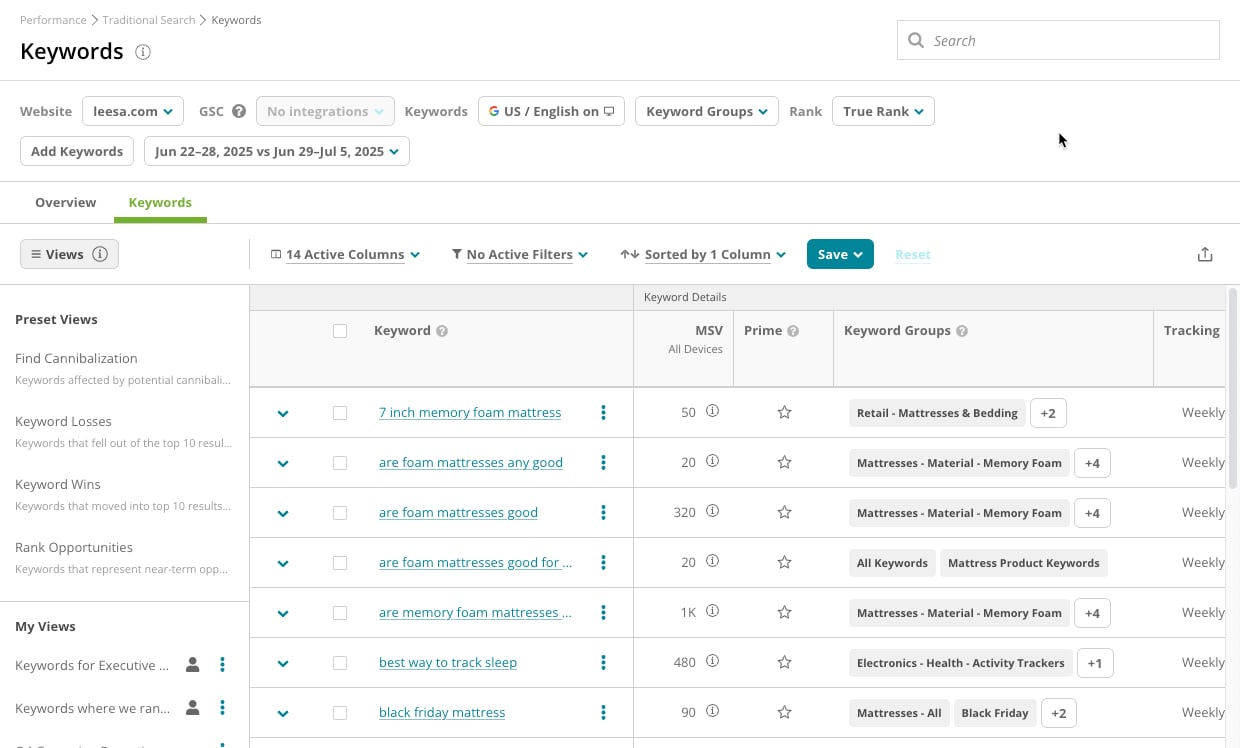
- Keywords provides you with direct access to your tracked keyword data and information about your top-ranking pages for each.
Determine the scope of your report
To focus on the most relevant and useful data to better address your specific goals, you can choose the context from which you want to see data. Configure the following controls at the top of the report to determine the data the Keywords report shows:- Use the Website menu to determine the site or sites for which you want to include rank data.
- Use the Keywords menu to set the search context for the data in the report—that is, the search engines and languages, the devices, and the locations you want to see rank data for.
- Use the Page Groups menu to select the page groups to limit the report to include only those pages on your website for which you want to see keyword ranks. Only keywords that rank for the pages that belong to these groups will appear in your report; any other keywords for which other pages on your website rank will not be included. You can apply up to 10 page groups.
-
Use the Keyword Groups menu to set the keyword group or groups you want to see data for.
Get logical! If you want more flexibility to create report segmentation, stack filters, or analyze overlapping keyword sets without creating separate keyword groups for every combination, you can choose whether selected groups should show keywords that match AND or OR logic:
- OR – any selected group. For example: choosing the
BrandedORUnbrandedkeyword groups includes keywords from either group. - AND – all selected groups. For example: choosing the
InsuranceANDEnglishkeyword groups includes only the keywords belonging to both groups.
- OR – any selected group. For example: choosing the
-
Use the Rank menu to select whether you want to see keywords sorted by True Rank or Standard Rank.

-
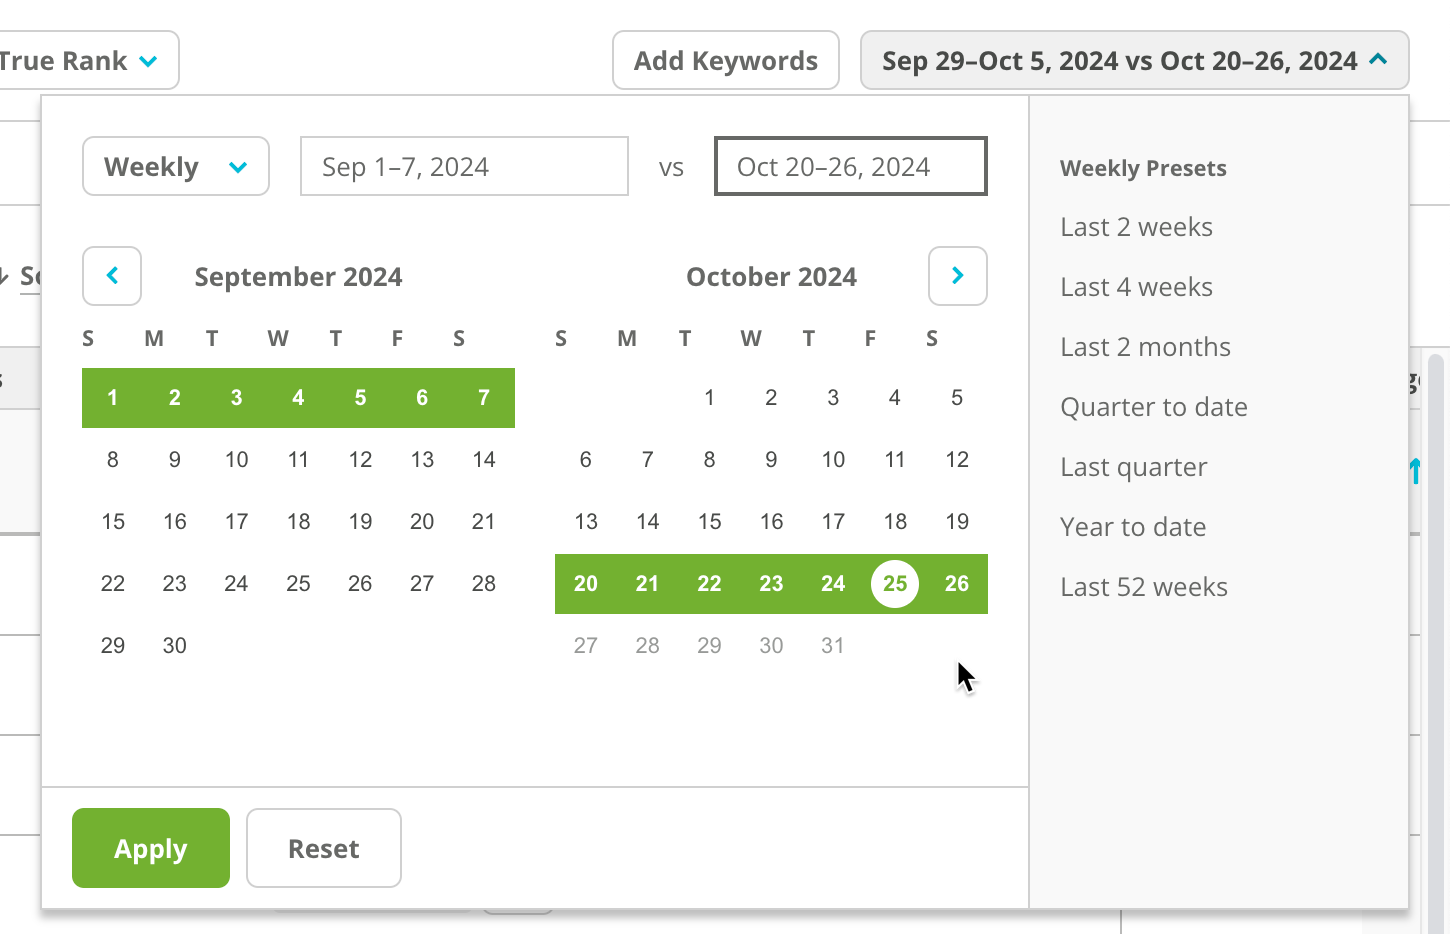
Use the Date Picker to select the date range and frequency you want to report on.
Refine data and reveal insights with a view
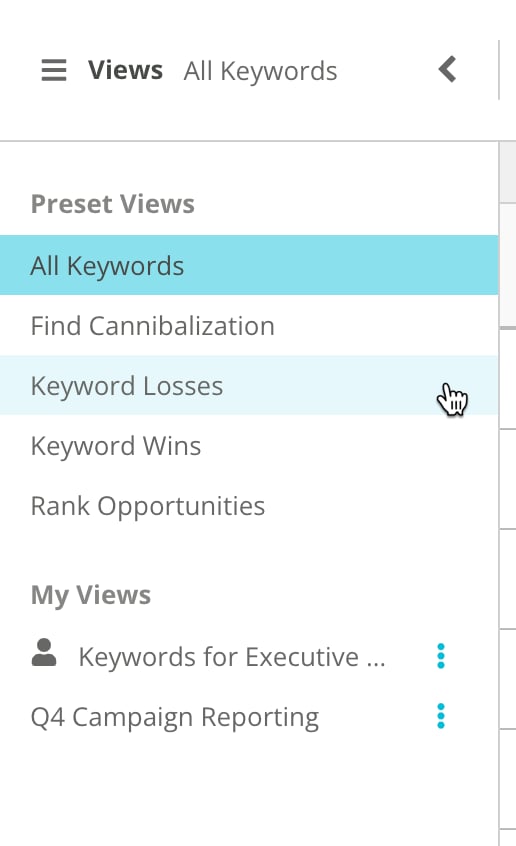
After determining the context at the top of the report, you can further filter the results in the table with preset or custom views. You can then save these views to use again and share them with your team.Preset views
By default, your report will include the following views:- All Keywords
- Find Cannibalization
- Keyword Losses
- Keyword Wins
- Rank Opportunities
Custom views
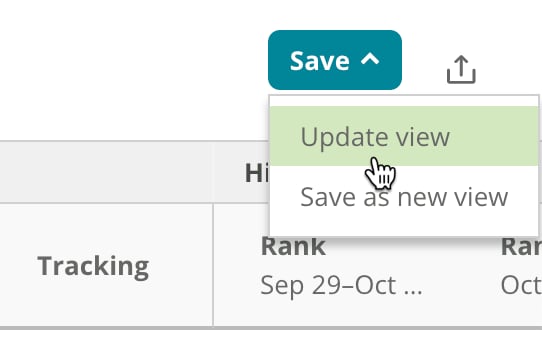
Filter your report in a way you want to save to use again? You can create a custom view. After choosing your filters and columns (learn more about filters and columns below):- Click Save > Save as new view.
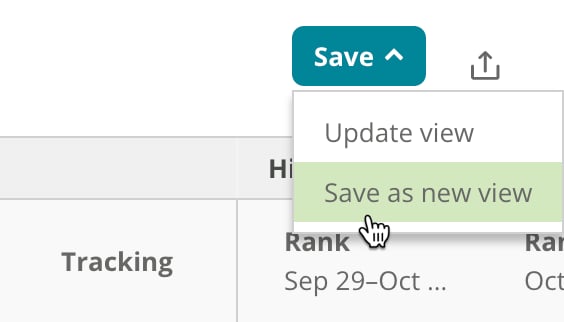
- Enter a name for the view and decide if you want to share it with other users on your account. By default, the view will be visible to you only.
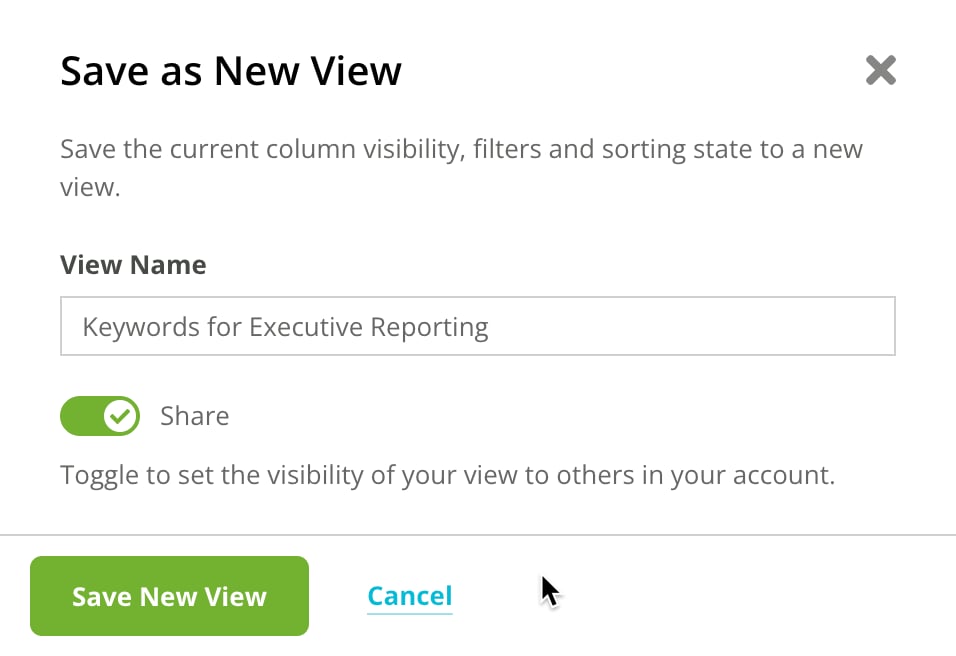
- Click Save New View. The custom view now appears in the My Views section.
Manage or delete a view
Want to change the name or shared status of a custom view? Or, maybe you no longer need a custom view you created? Just click the three-dot menu to reveal options for managing or deleting your custom views.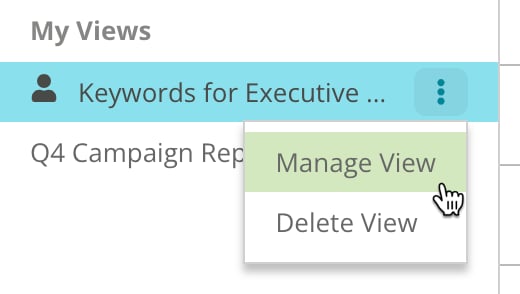
Review trended data in the Overview tab
Keyword performance
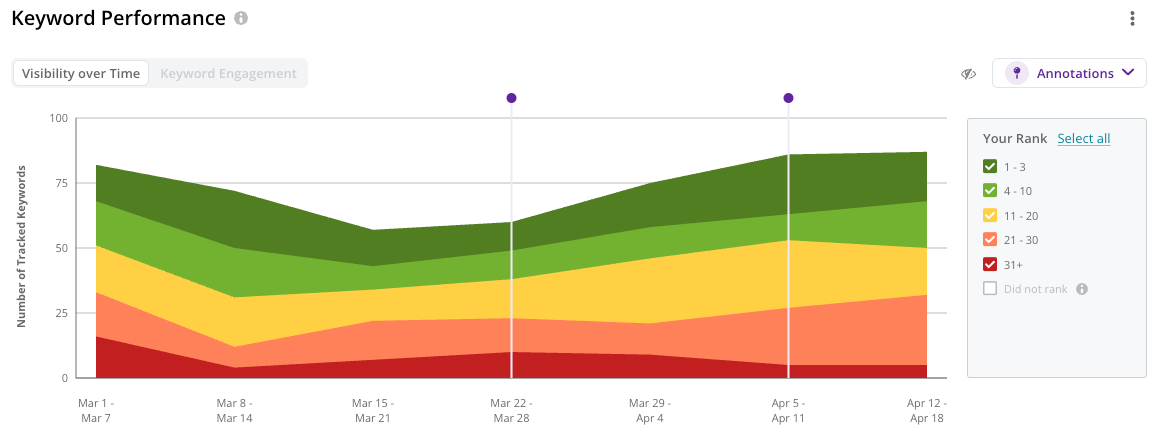
This chart shows you a trended view of your:-
Visibility Over Time—your keyword ranks, grouped across visibility zones. This view offers an at-a-glance view of your overall keyword performance.
-
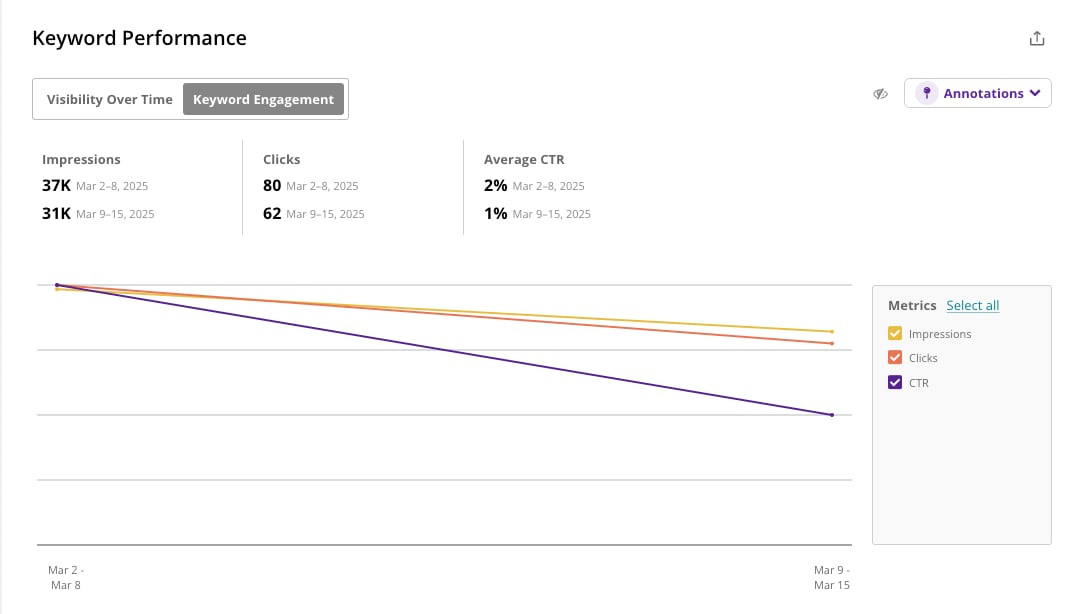
Keyword Engagement—your Impressions, Total Clicks, and Average CTR for your tracked keywords, integrated from Google Search Console. This view offers search engagement reporting to see how users are interacting with results from your website.
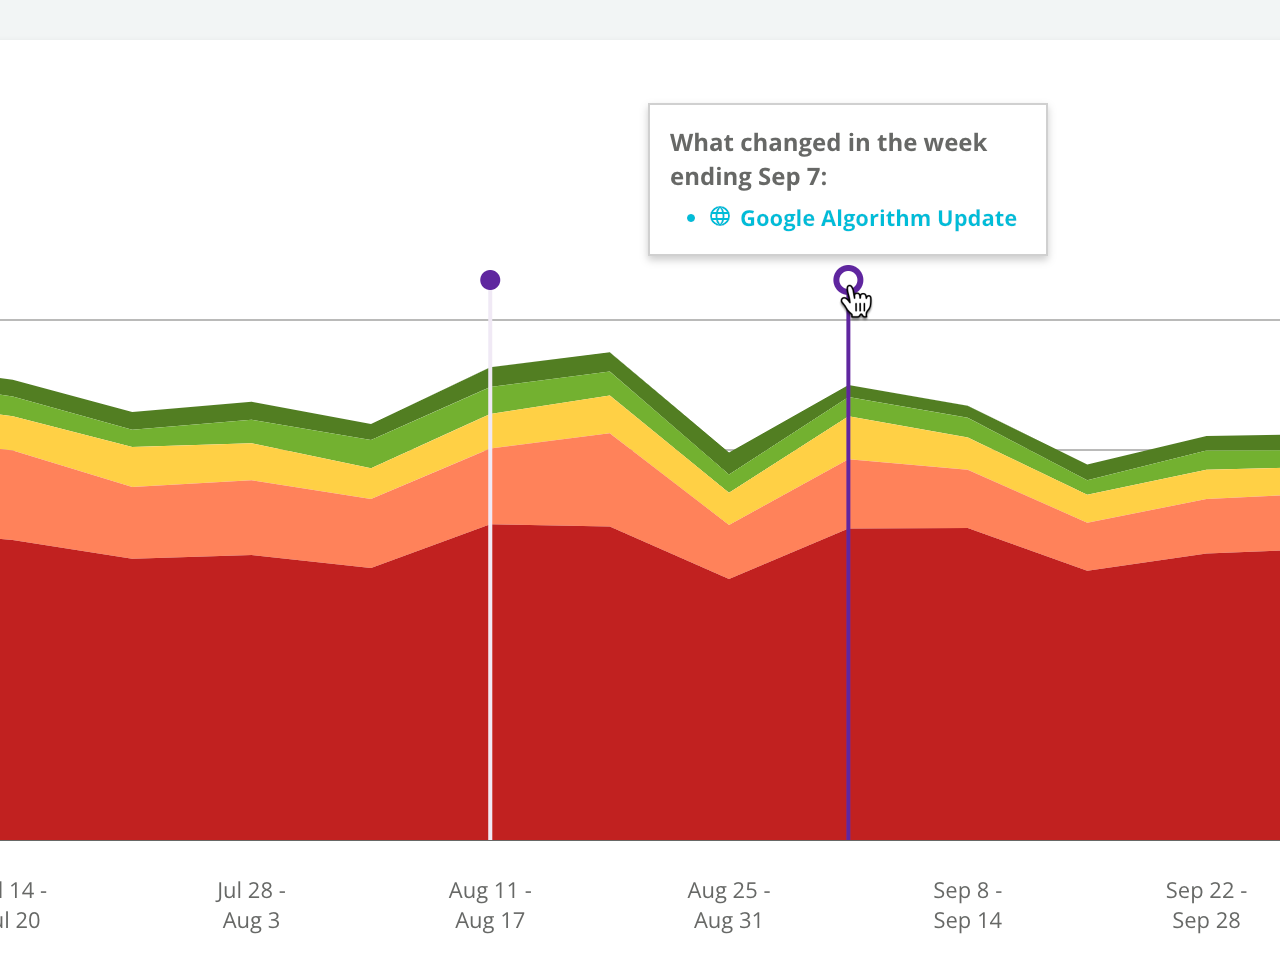
How do I create a custom annotation?You can add custom annotations to track your progress and keep tabs on the work you’ve done. Learn how to create custom annotations.
Result types
-
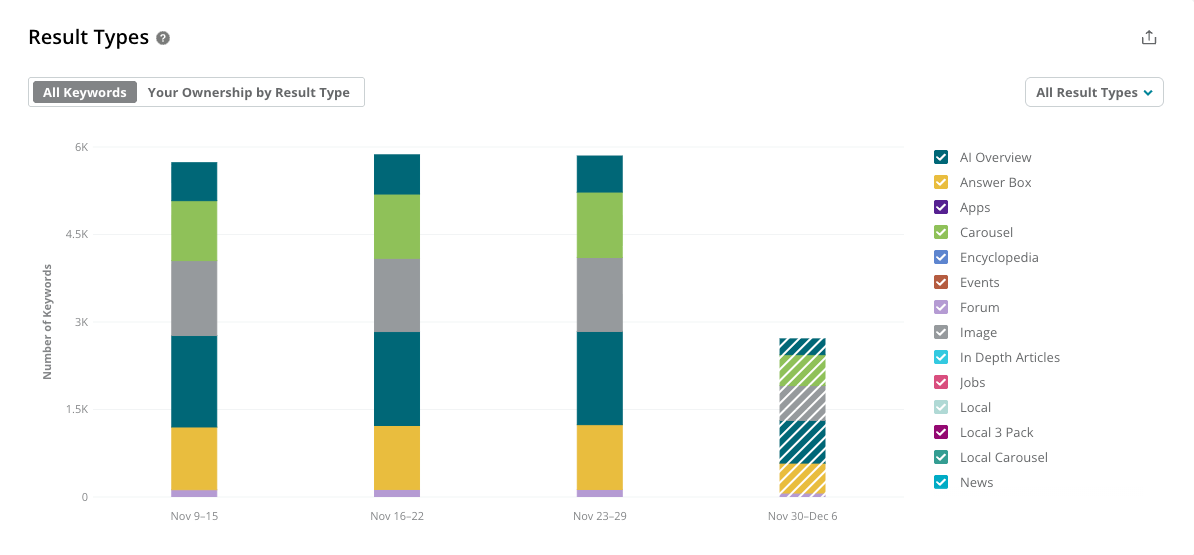
See all the universal result types your results appear in across All Keywords, and track how your visibility changes over time.
-
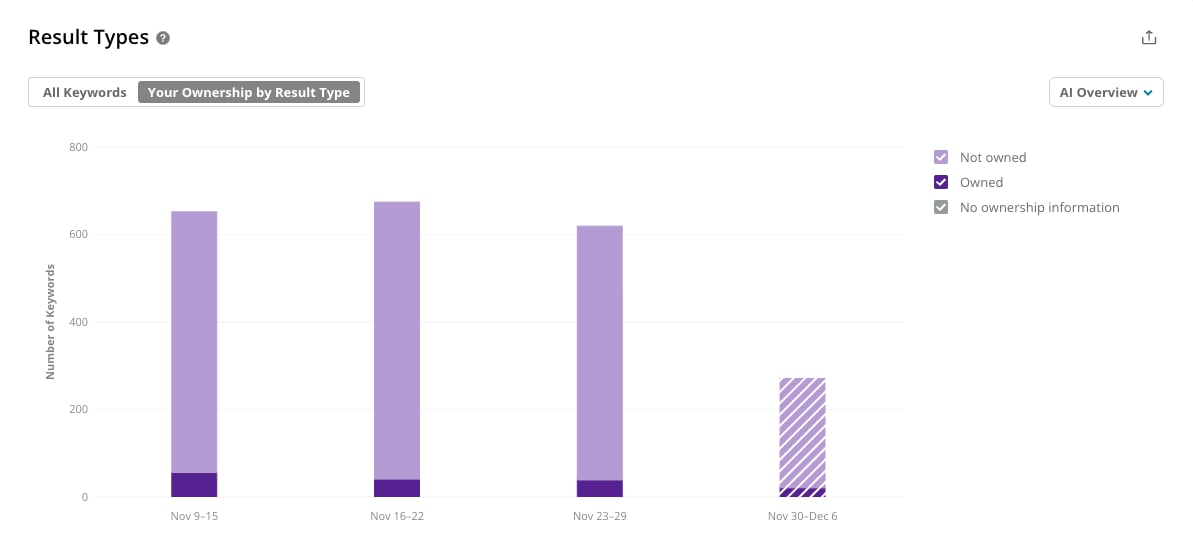
View the Ownership by Result Type chart to understand your ownership for each result type and how it evolves over time.
Top locations
The Top locations widget shows how your website performs across the locations you track. The map highlights your tracked countries and cities, and the list ranks your top locations, with each location’s share of voice.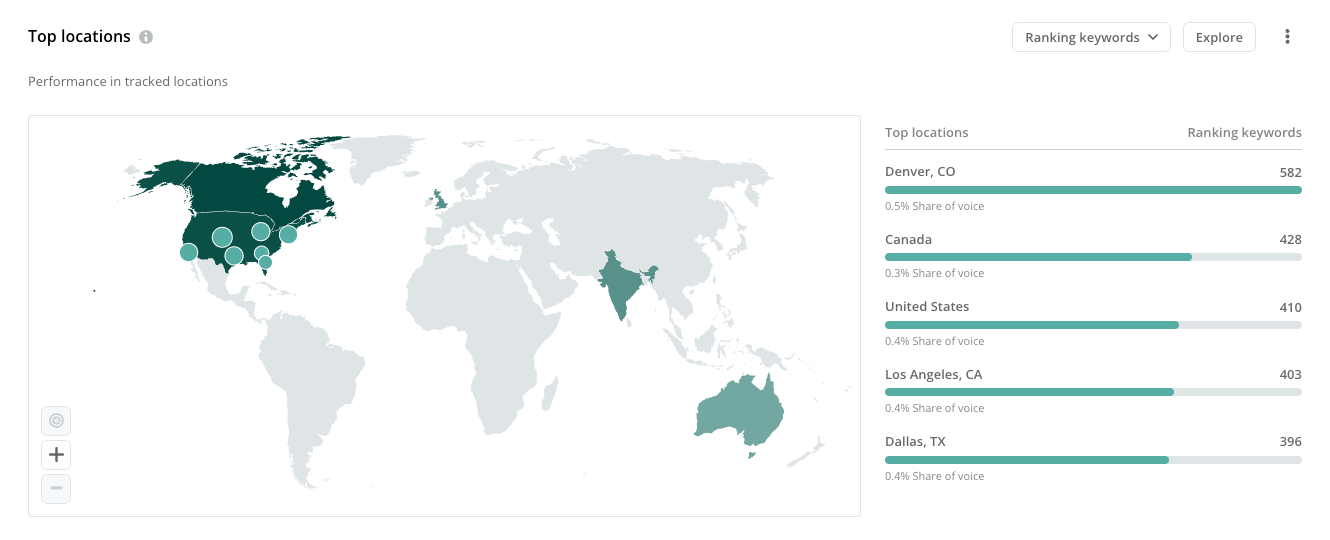
- Use the menu at the top of the widget to rank locations by Ranking keywords or by Share of voice—your website’s share of rankings in that location.
-
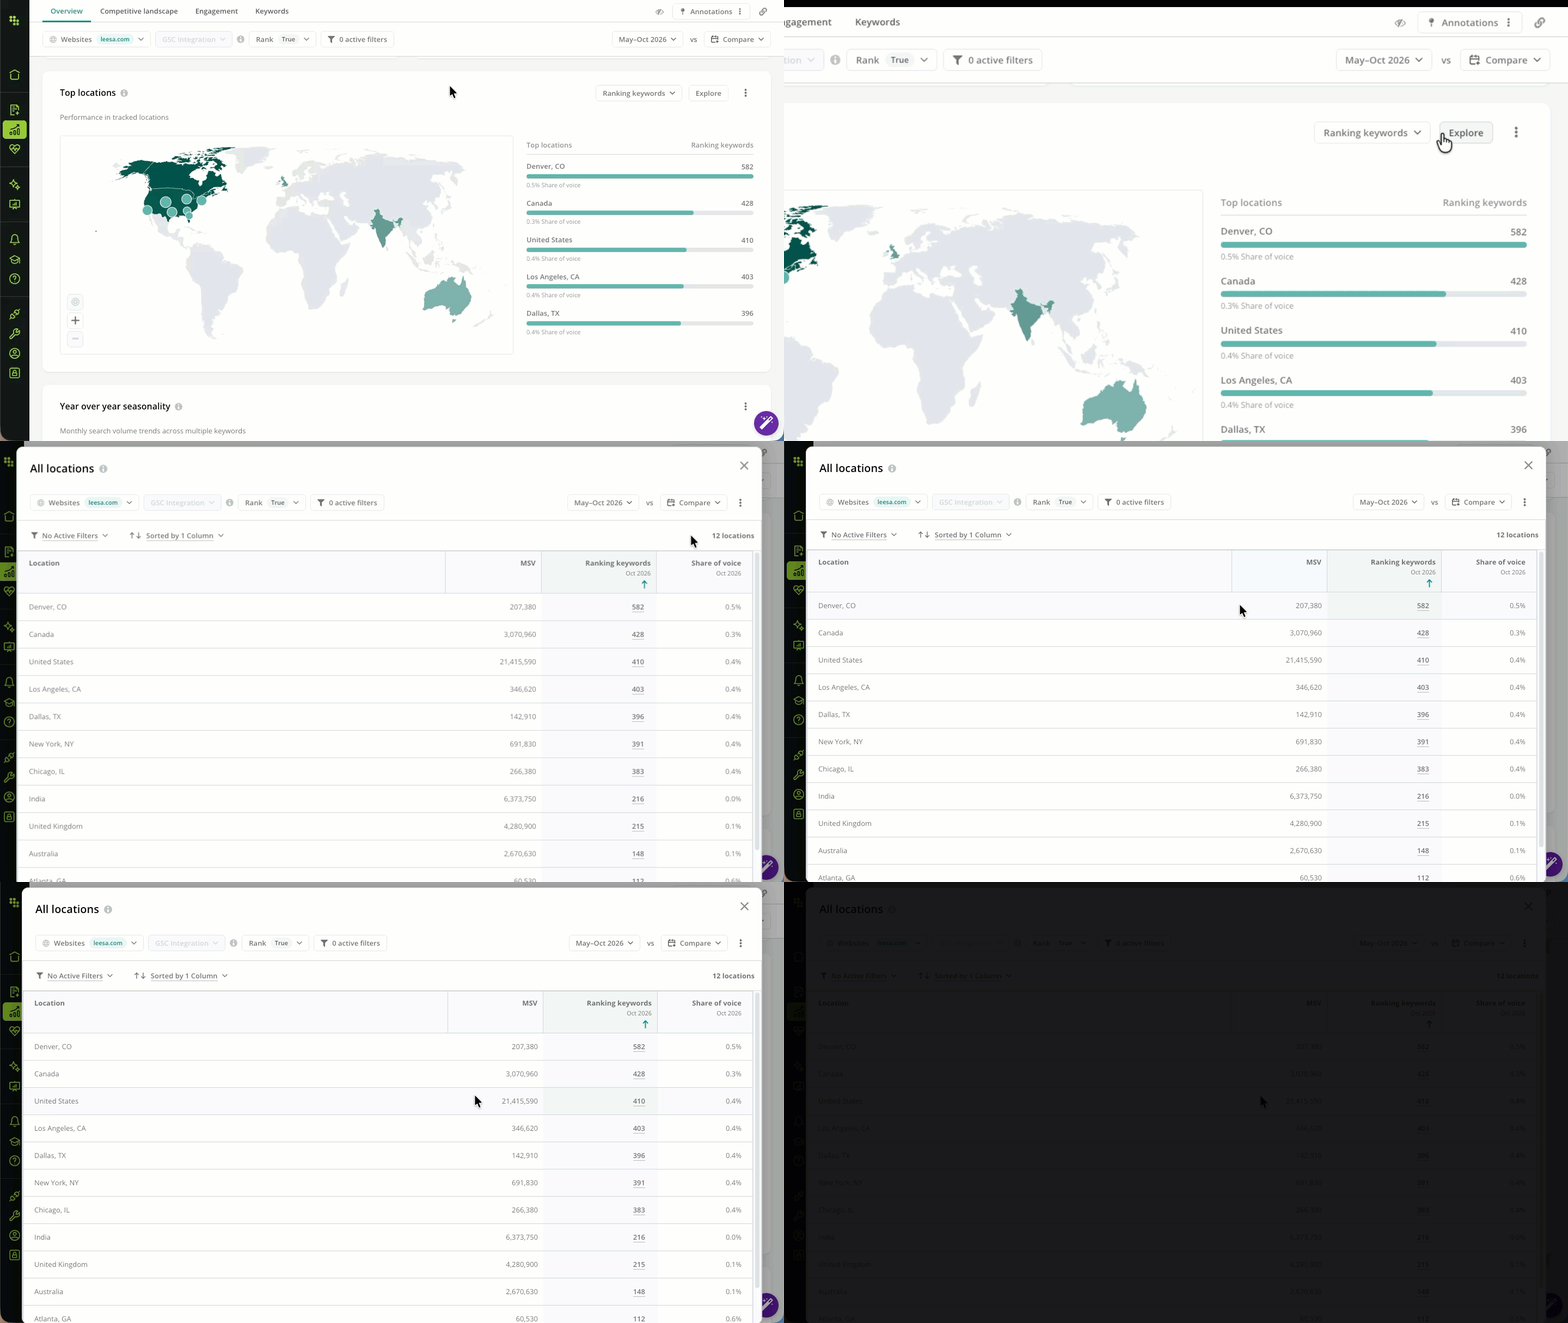
Click Explore to open the All locations table, which lists every tracked location with its:
- MSV across your tracked keywords
- Ranking keywords for the selected time period
- Ranking keyword change since the comparison period (if comparing periods)
- Share of voice for the selected time period
- Share of voice change since the comparison period (if comparing periods)
- Use the three-dot menu to Add to a Workspace, Download as Image, or Download table XLSX.
Seasonality
The Seasonality chart helps you understand and respond to fluctuations in search behavior that occur throughout the year. The chart shows search demand—using monthly search volumes for the keywords you are reporting on—trended year-by-year.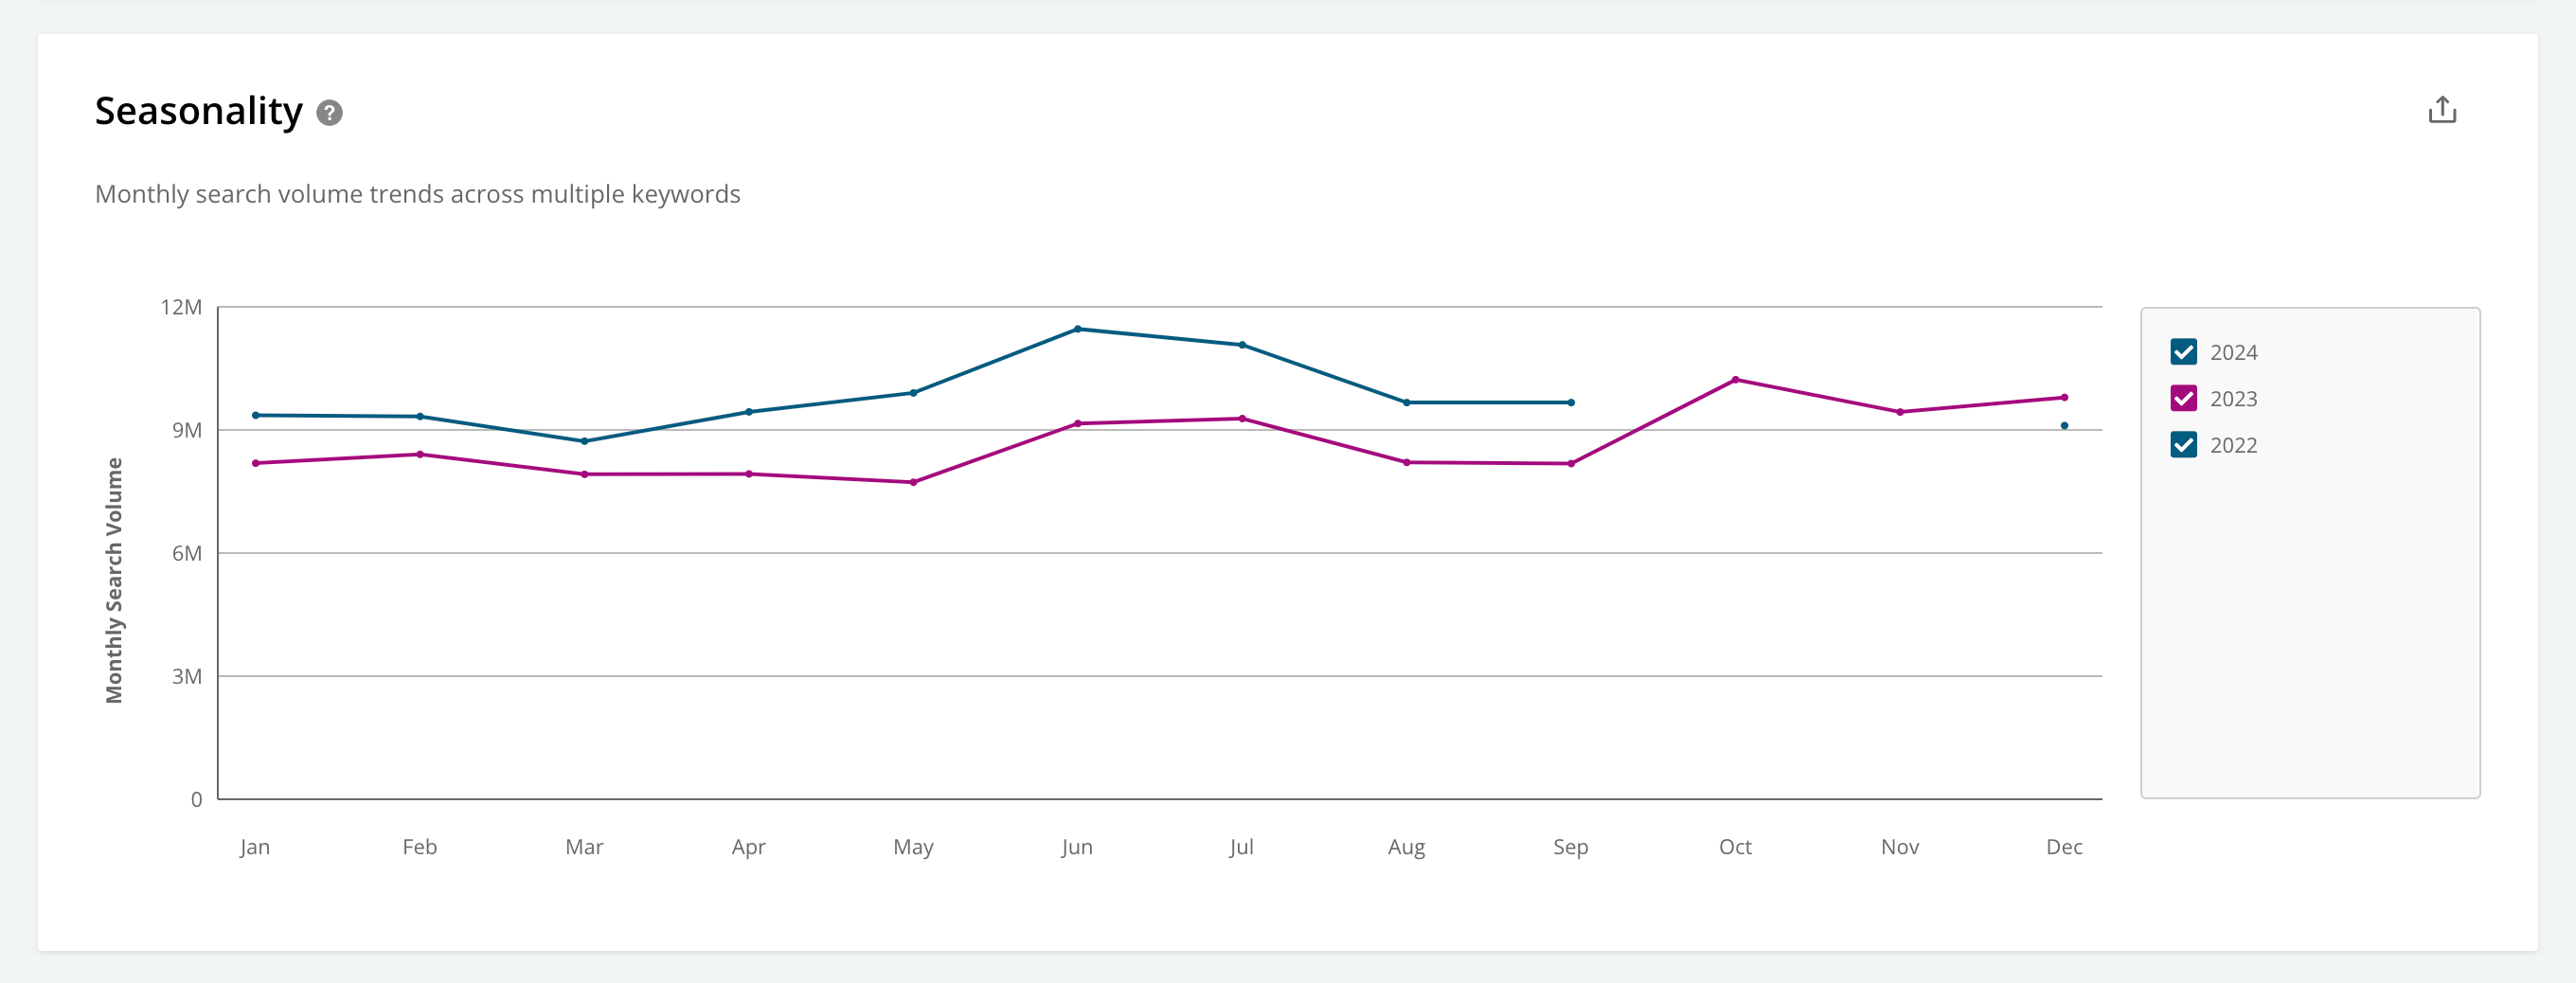
In Keywords, Conductor publishes approximate monthly search volumes for keywords as soon as it has the data collected for the time periods in question. Until that point, the monthly search volume for a keyword reflects an average of the previous 12 months.When at least 10% of the keywords you are reporting on are using averaged search volumes, you’ll see this indicated by a dashed line and the following tooltip for any affected time periods in the chart:
“Data includes 12-month average MSV: awaiting search engine update”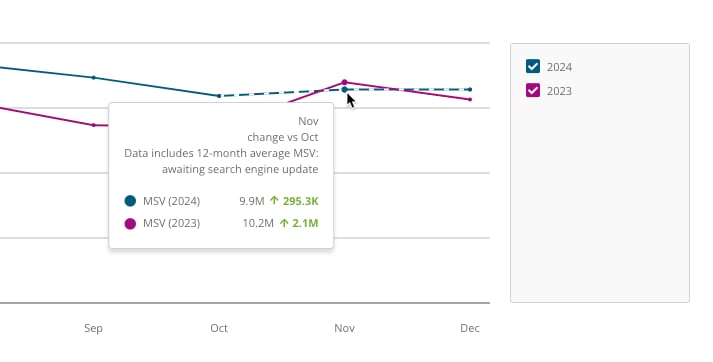
Top keyword groups
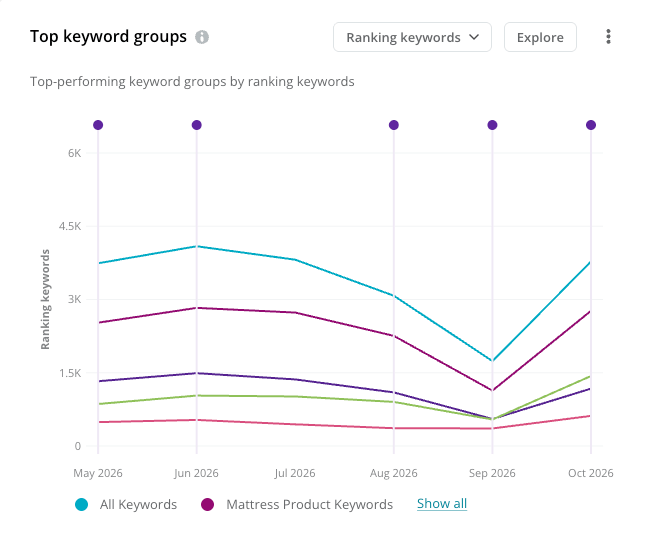
You track thousands of keywords, but you probably make decisions about groups of them—branded vs. non-branded, product lines, content initiatives, or striking-distance sets. The Top keyword groups widget shows which parts of your keyword portfolio are gaining or losing ground. The widget plots trend lines for your top five keyword groups over the selected date range. Use the measure dropdown to switch between:- Ranking keywords—how many keywords in each group rank. Use it to answer “How much am I visible for?”
- Share of voice—how much of the top 10 results each group owns. Use it to answer “How much of the top 10 do I own?”
Compare all your keyword groups
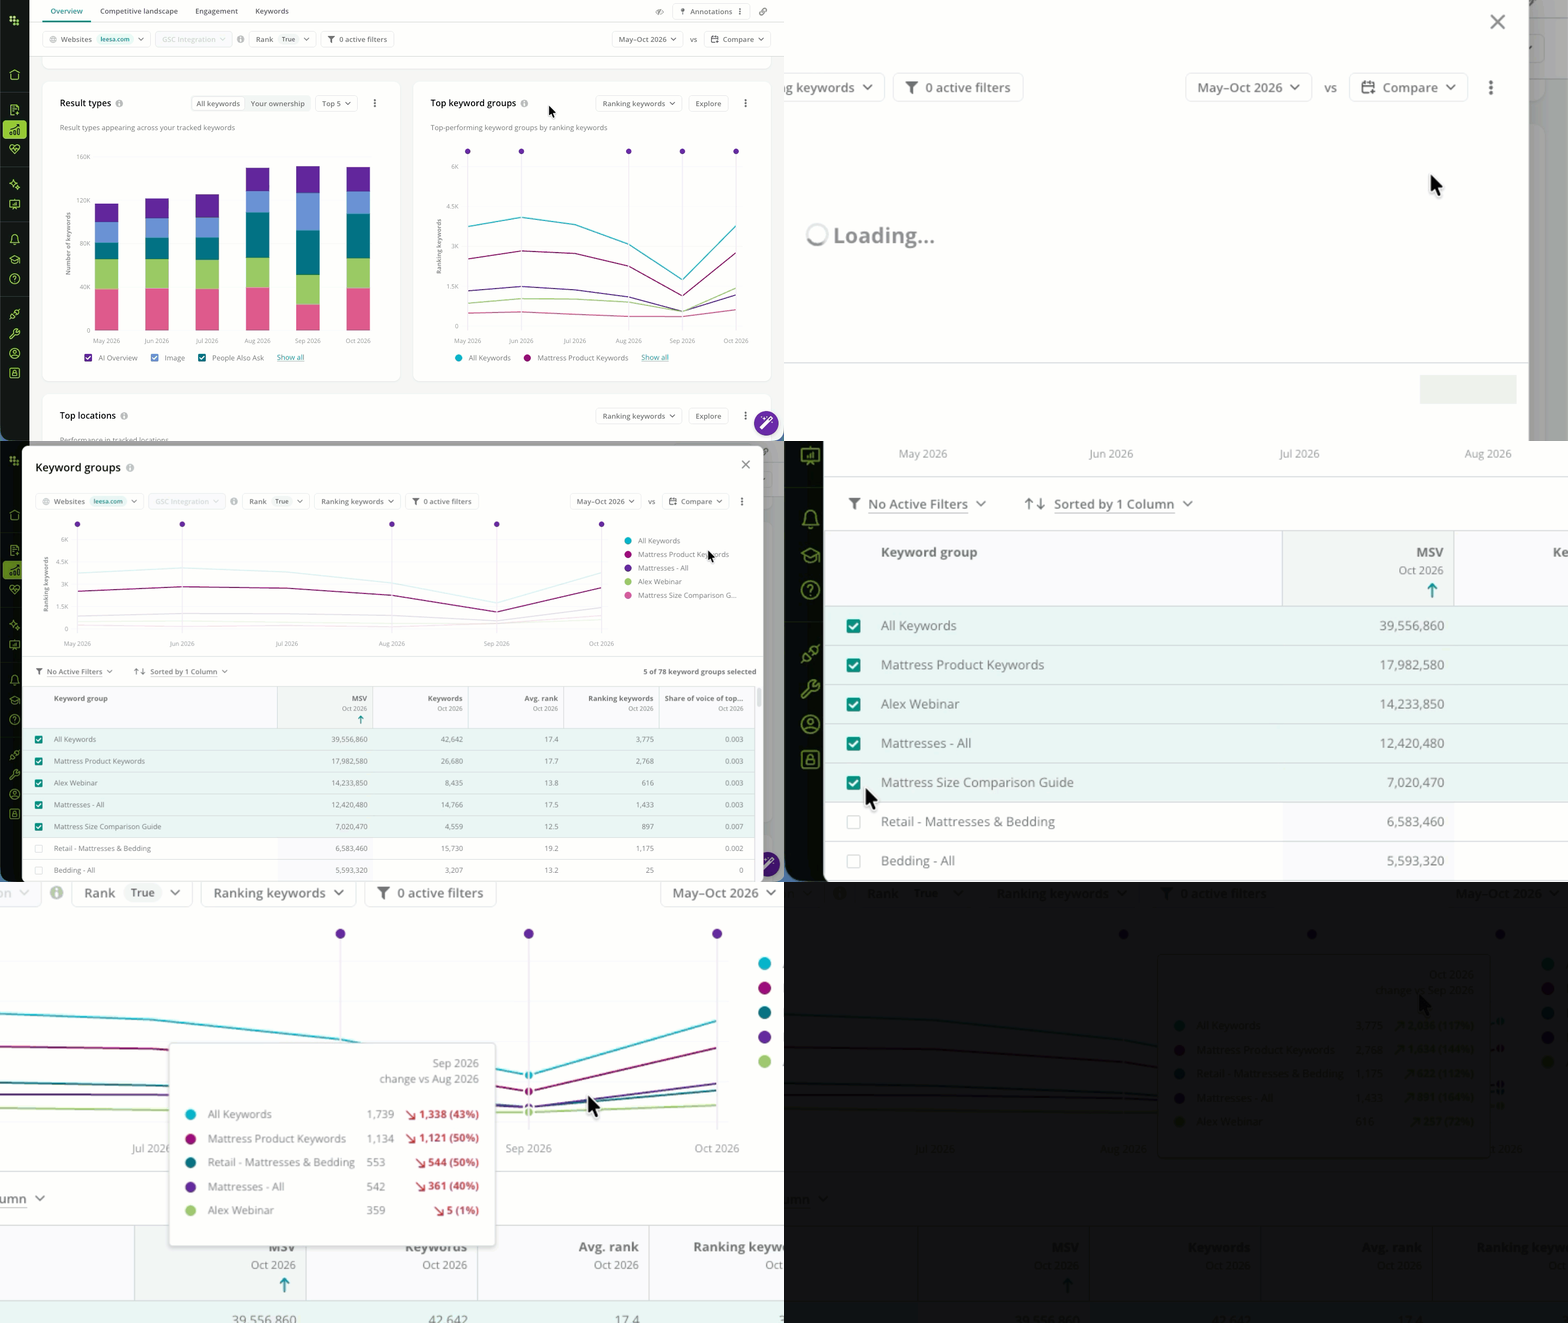
Click Explore to open the Keyword groups view and compare every keyword group in your account:- Set the context with the report controls above the chart and with the column-level filters.
- Review each group’s:
- MSV
- Number of Keywords
- Avg. Rank
- Avg. Rank Change (if comparing periods)
- Ranking Keywords
- Ranking Keywords Change (if comparing periods)
- Share of voice of top 10
- Share of voice of top 10 change (if comparing periods)
- Select the checkboxes next to the groups you want to plot to build your own comparison in the chart.
Review your competitive position in the Competitive landscape tab
The Competitive landscape tab shows how your website’s share of rankings compares to the other websites ranking for your tracked keywords. Use it to understand who you compete with on the search engine results page, which pages rank most often across the market, and which keyword groups competitors lead.Scope your competitive comparison
In addition to the scoping controls described above, the Competitive landscape tab includes the following controls:- Choose Entire market to benchmark your website against every website Conductor discovers ranking for your tracked keywords, or Tracked competitors to limit the comparison to the competitors configured for your account.
- Use the positions menu to calculate the data on the Top 1, Top 3, Top 5, or Top 10 positions of the search engine results page.
- Choose Weighted or Not weighted data. Weighted data accounts for each keyword’s monthly search volume; Not weighted data treats every keyword equally.
- Choose the Result Types you want to see data for to understand your performance for SERP features compared to your competition.
Your website ranking share of voice
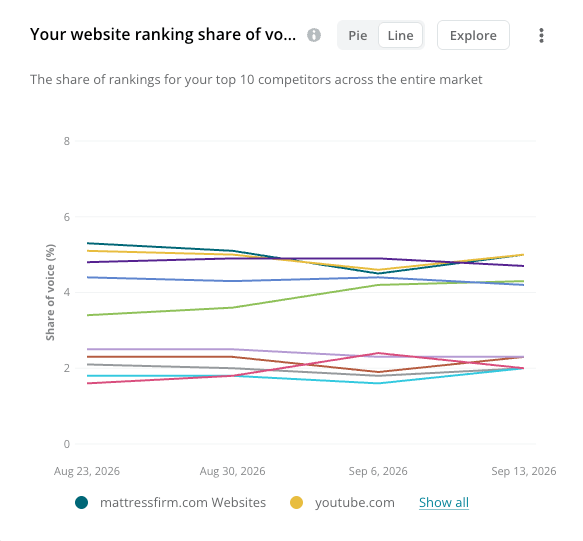
See how your website’s ranking share of voice compares to the competitive landscape over time. Switch between the Pie and Line views to explore the latest period’s distribution or trends across your selected date range.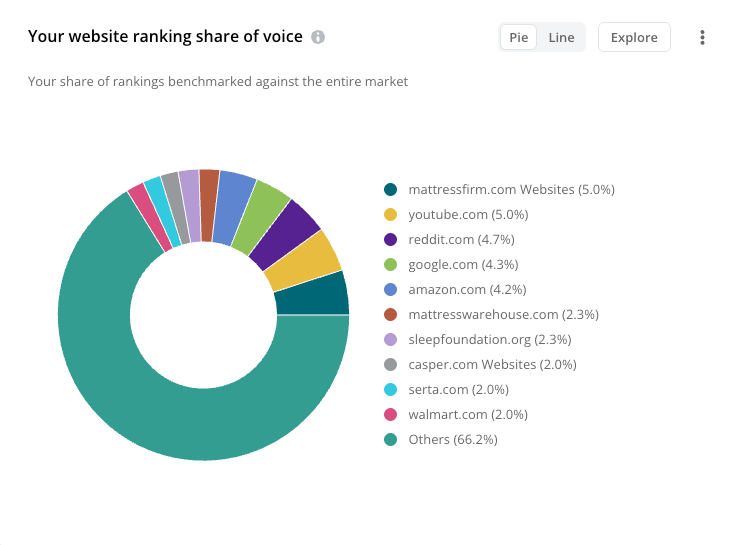
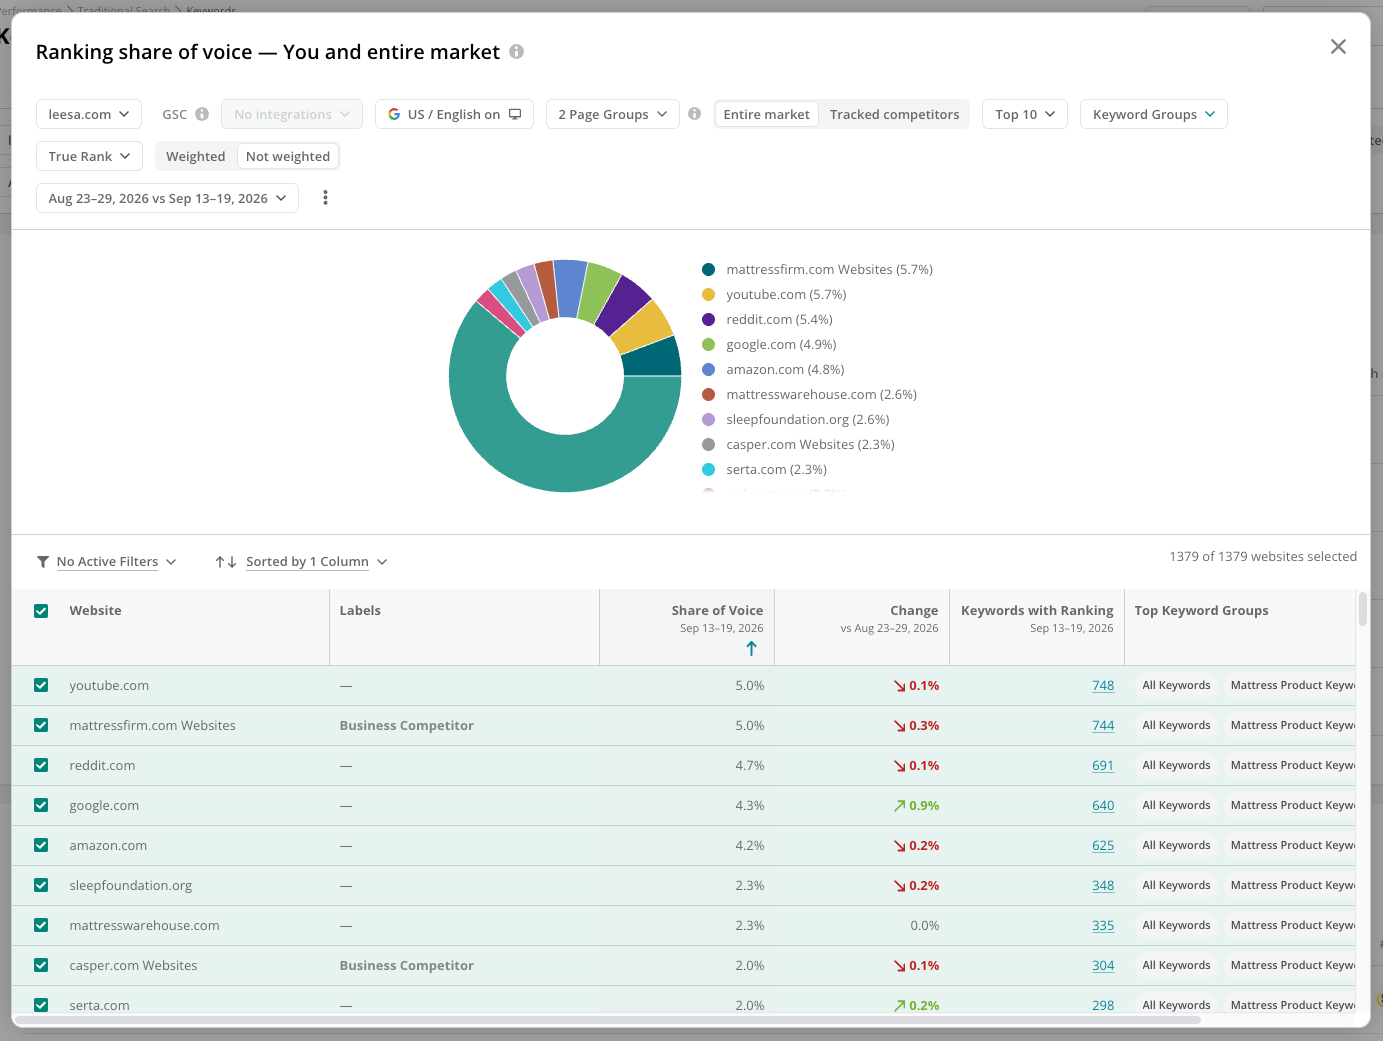
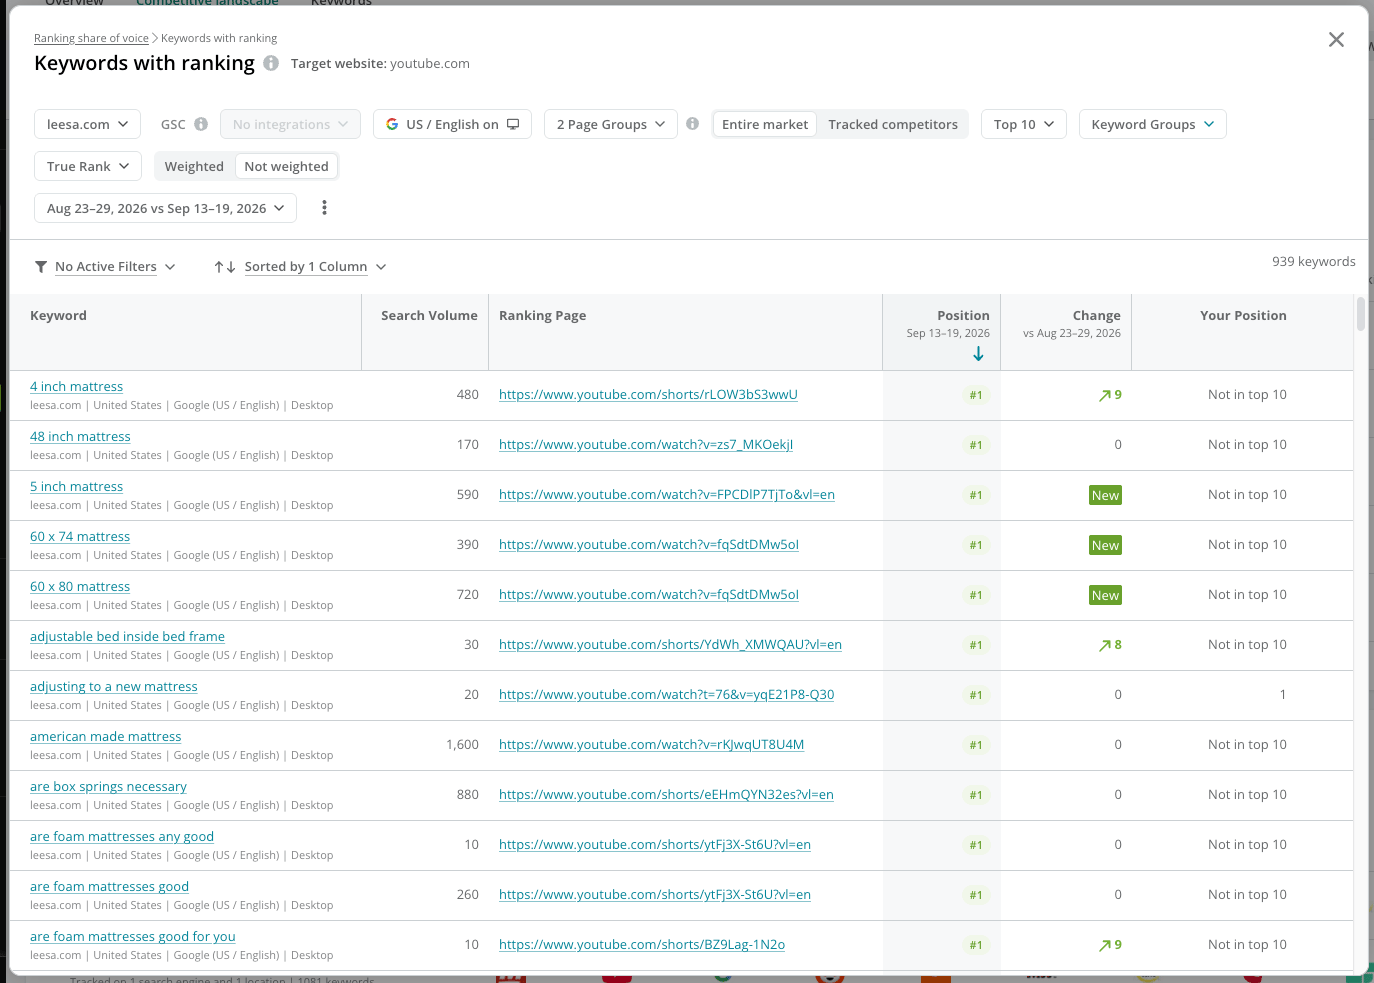
Compare your website to your competitors’
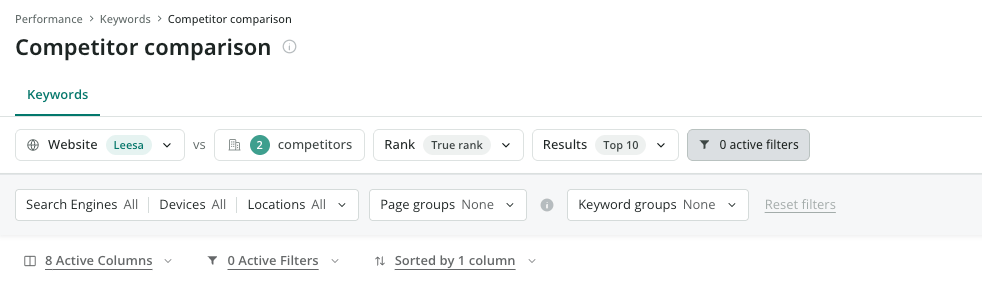
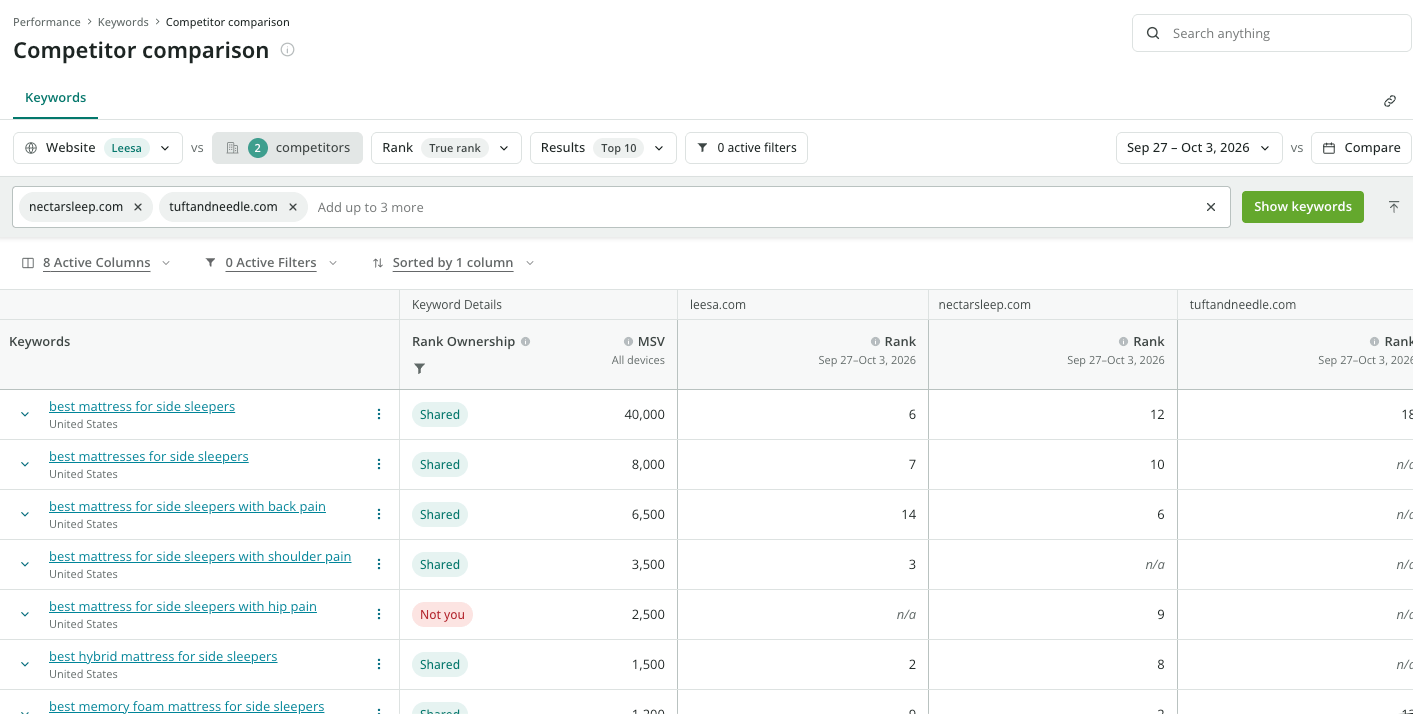
Want to see exactly where you and your competitors rank, keyword by keyword? Click Go to competitor comparison at the bottom of the Your website ranking share of voice widget to open the Competitor comparison report (Performance > Keywords > Go to competitor comparison).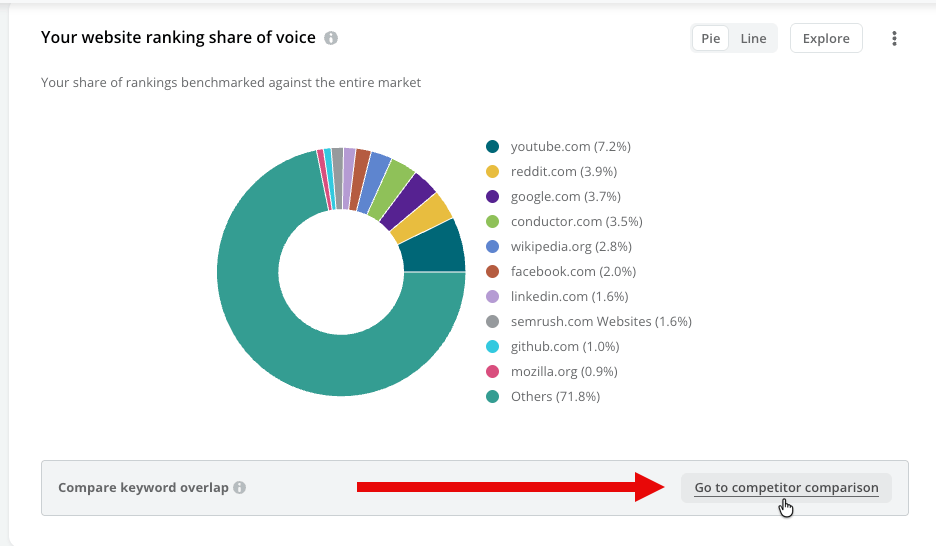
- Use the Website menu to choose the website you want to compare.
-
Choose up to five competitors to compare against. The competitors available come from the competitors configured for your account and the top rankers for your tracked keywords.

- Click Show keywords.
-
Further refine the scope of the keywords in the report, as necessary:
- Use the Rank menu to choose True Rank or Standard Rank.
- Use the Results menu to limit the comparison to the top positions of the search engine results page (for example, Top 10).
- Choose the Search Engines, Devices, and Locations for which you want to review rank performance compared.
- Choose up to 10 page groups for which to see data. The report will show data for only the pages belonging to these groups; all other pages from your website are ignored. Currently, this filter supports smart page groups determined using title and URL rules and custom page groups.
- Choose any number of keyword groups to filter the keywords included in the report.
- Use the date picker to choose the time period to report on, and Compare to compare it with a previous period.
- Rank Ownership, which shows whether you share rankings for the keyword with your competitors (Shared) or only your competitors rank for it (Not you).
- MSV, the keyword’s monthly search volume across all devices.
- Rank for your website and each competitor during the selected time period. n/a means the website doesn’t rank for the keyword within the selected results.
Top ranking pages
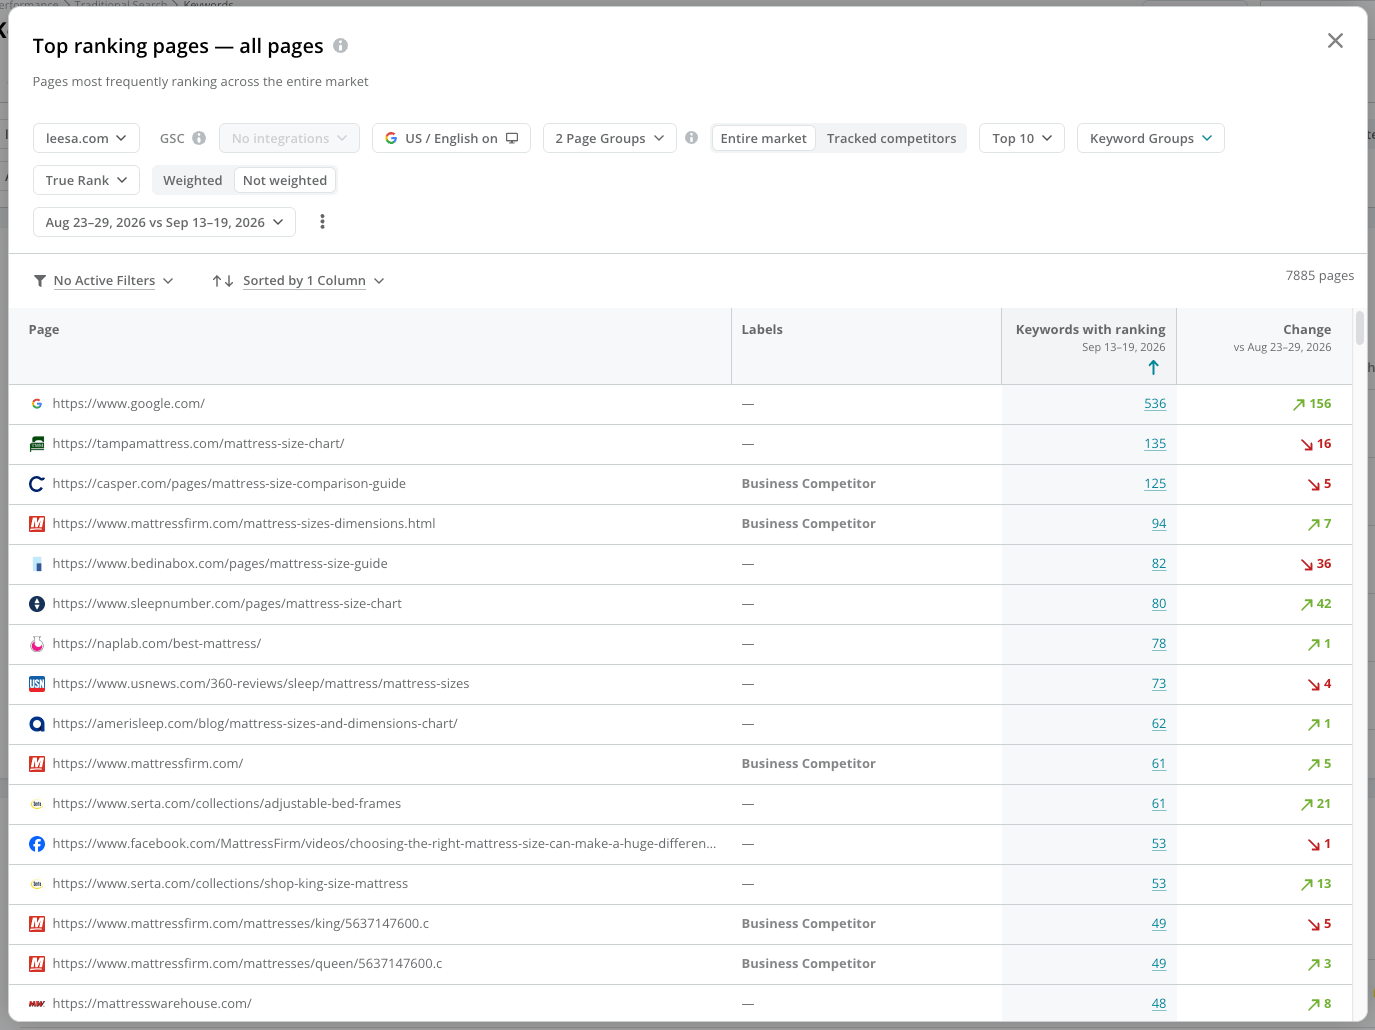
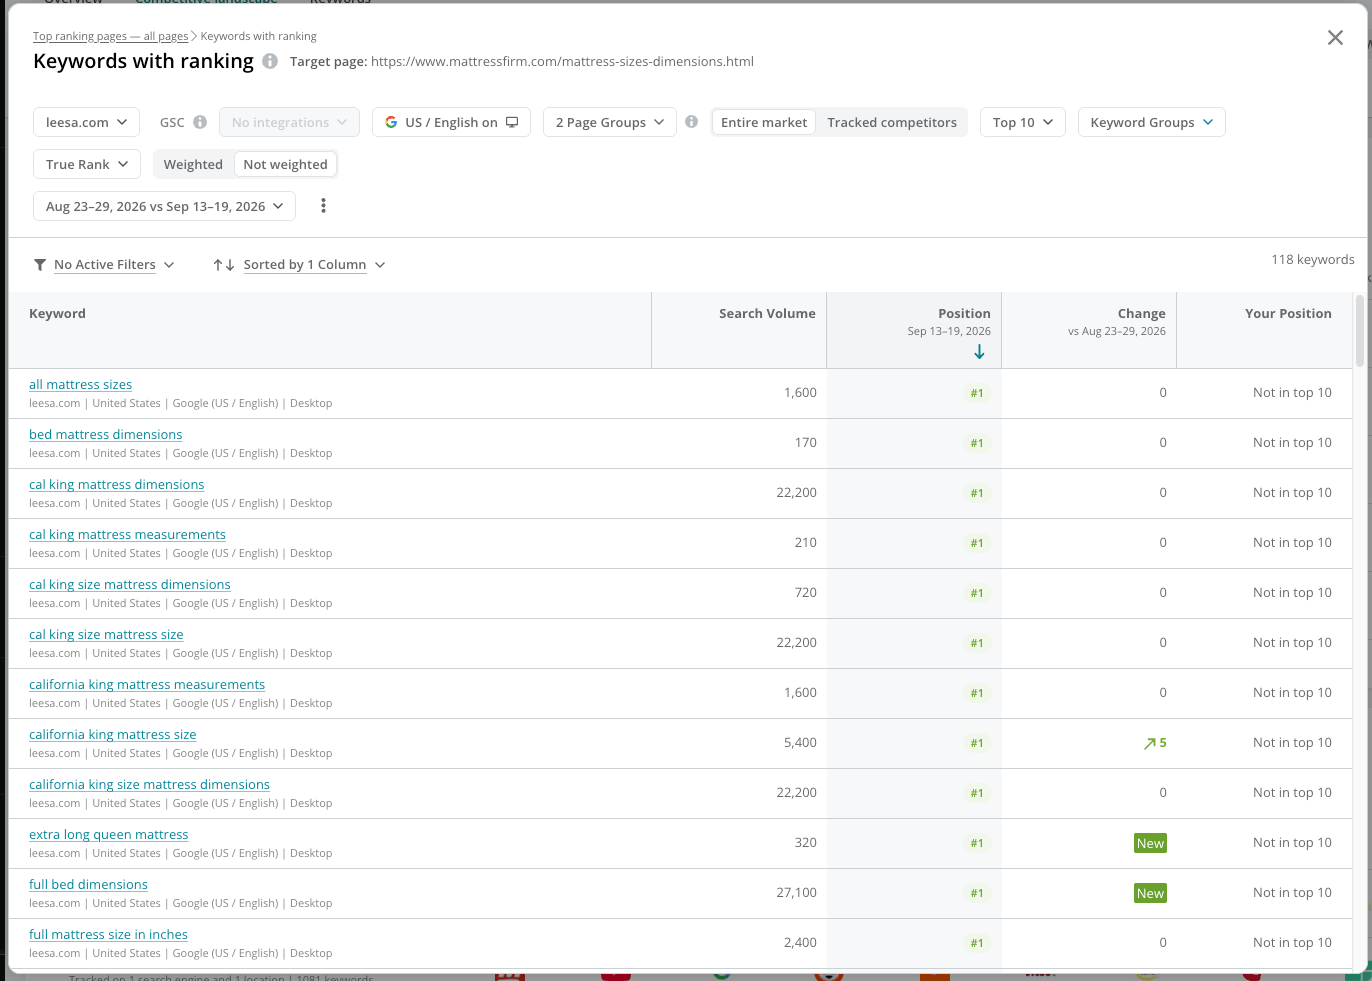
See which pages rank most frequently across your competitive landscape for the selected time period. The leaderboard highlights the pages that appear most often in the top results, with the change in their ranking footprint versus the comparison period.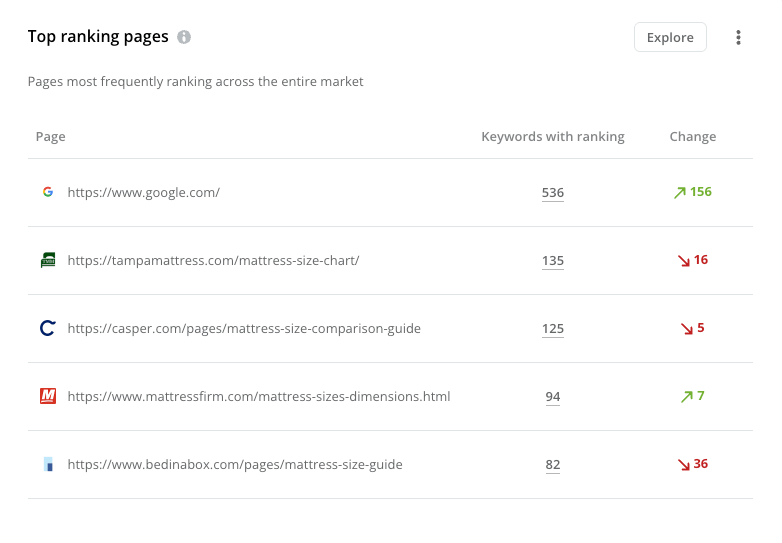
Competitive landscape by top keyword groups
See which competitors rank most frequently across your top keyword groups, defined by the highest number of tracked keywords. Compare results and identify opportunities based on the most recent time period’s performance.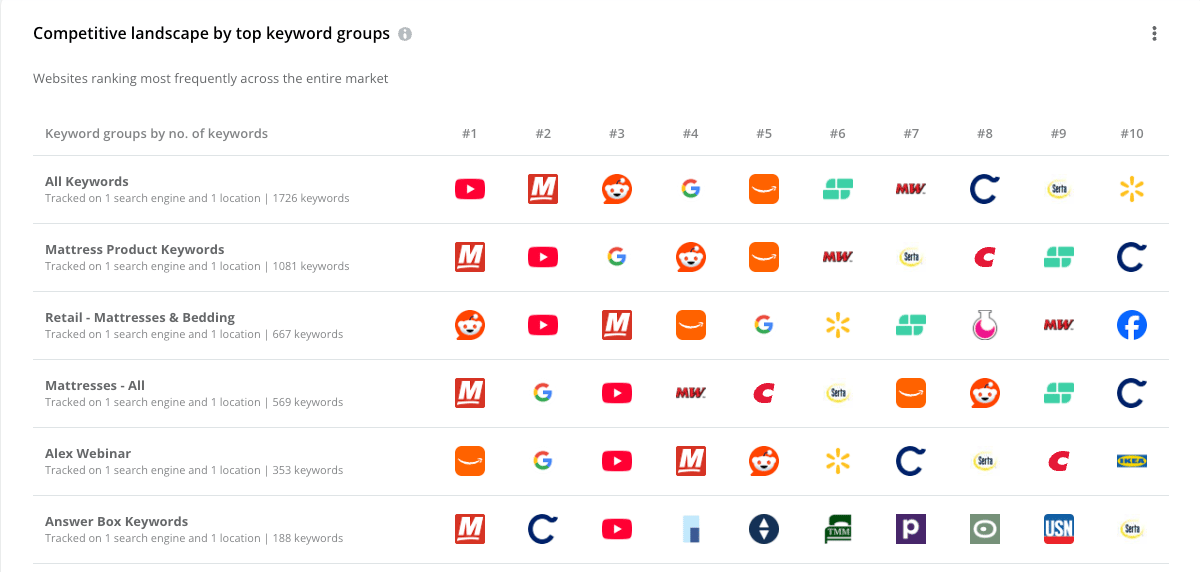
Review search engagement in the Engagement tab
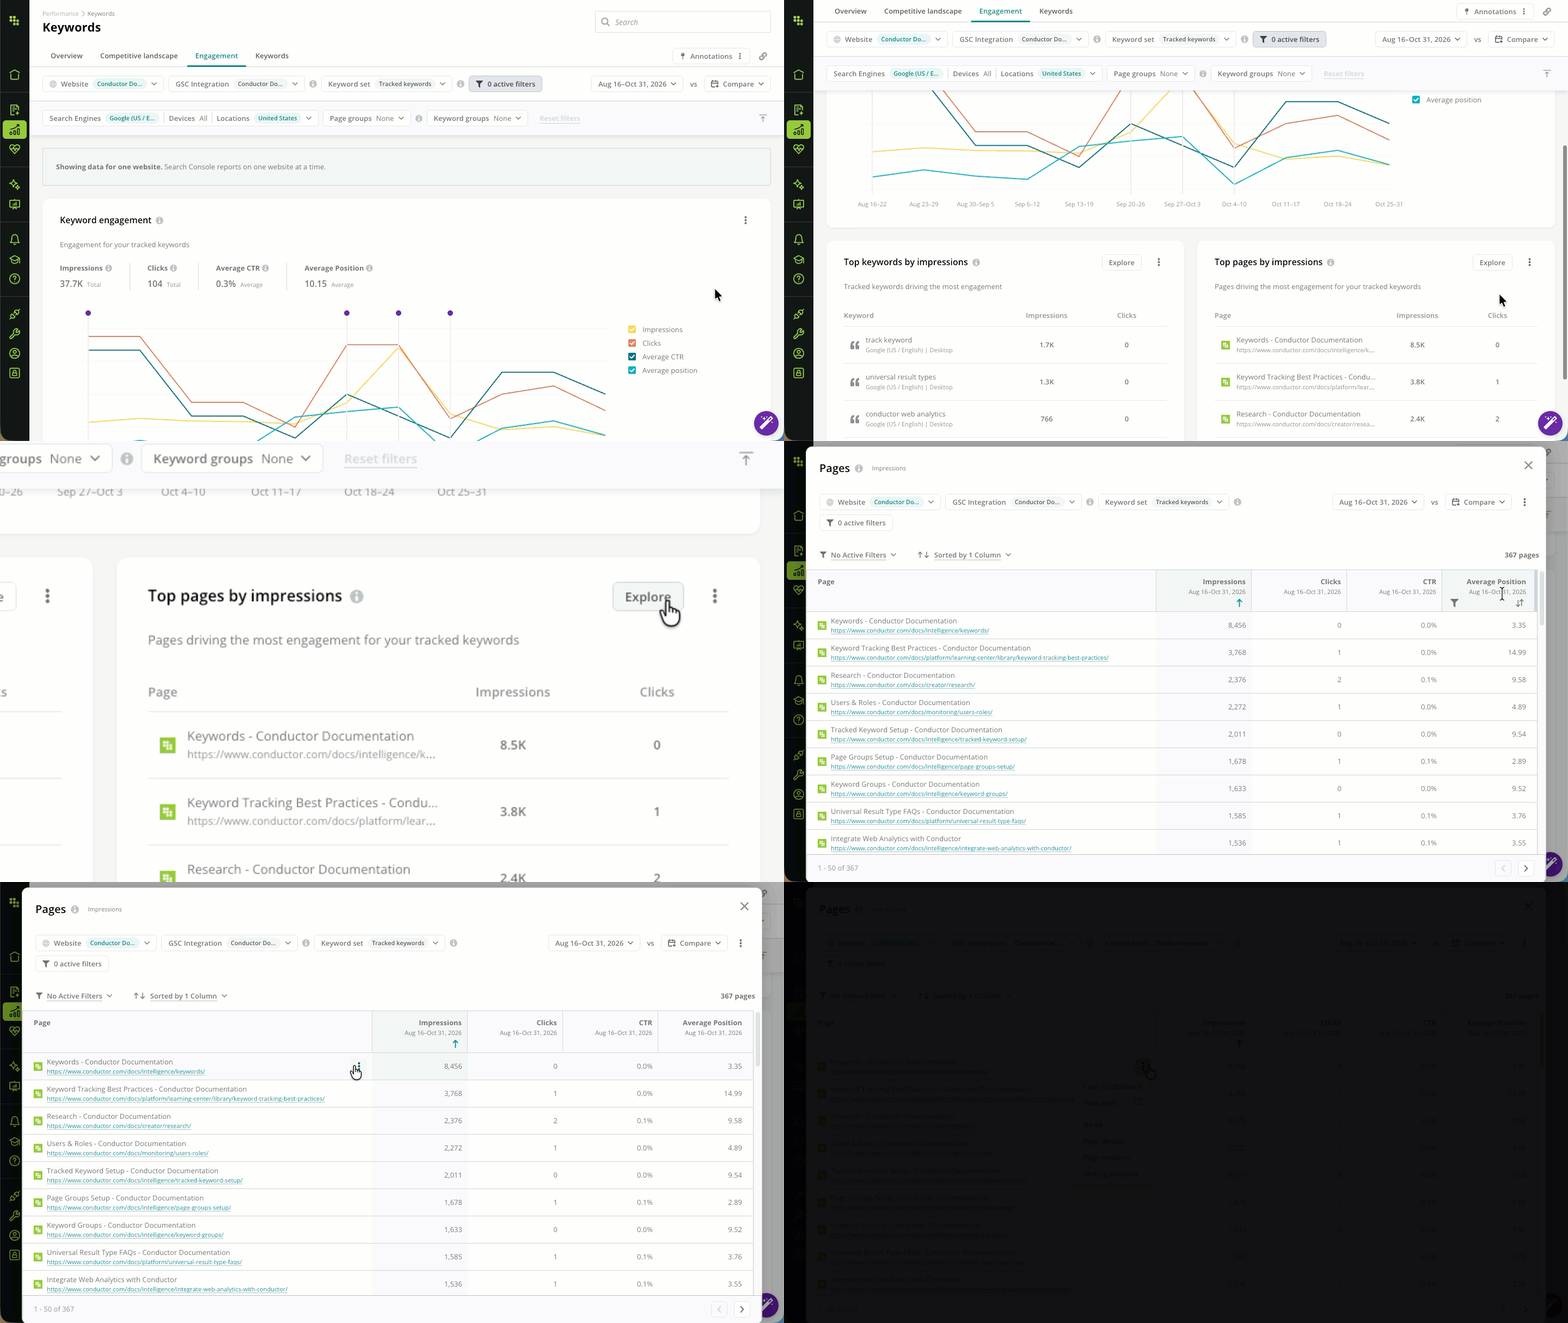
The Engagement tab shows how your keywords perform in Google search, using data from your Google Search Console integration. See how often your pages appear in search results, how often searchers click through, and which keywords and pages drive that engagement—without leaving Conductor.The Engagement tab uses data from a Google Search Console integration for the website you’re reporting on. If the website doesn’t have one yet, the tab prompts you to Connect Google Search Console. Learn how to integrate Google Search Console with Conductor Intelligence.
Scope your engagement data
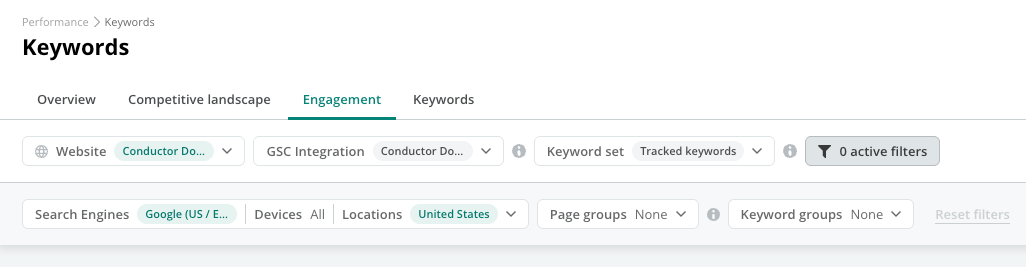
The Engagement tab includes the following controls to determine the scope of your reporting:- Website. Select a single website. Search Console reports on one website at a time.
- GSC Integration. Choose which of the website’s Google Search Console integrations to pull data from.
-
Keyword set. Use this menu to switch between two views of your search engagement:
- Tracked keywords shows only the keywords you track in Conductor that also have Google Search Console data. Use this view to measure how your intentional keyword strategy is performing, without the long tail of incidental queries.
- All GSC keywords shows every query Google Search Console reports impressions and clicks for on your website, whether or not you track it in Conductor. Use this view for discovery: find the terms you’re already getting found for, including keywords you haven’t set up yet. In this view, data is grouped by query across search engines, locations, and devices.
- Search engines, Devices, and Locations. Narrow the data to a specific search context. When you view All GSC keywords, the search engines and locations you can choose from may differ from your tracked keyword setup.
- Keyword group and Page group. Available only when you view Tracked keywords.
Review your keyword engagement trends
The Keyword engagement chart summarizes your search engagement for the selected website and date range:- Impressions. The number of times your pages appeared in search results.
- Clicks. The number of times searchers clicked through to your pages.
- Average CTR. Click-through rate—your clicks divided by your impressions.
- Average Position. The weighted average ranking of your pages across the keywords in your selected view.
Find your top keywords and pages
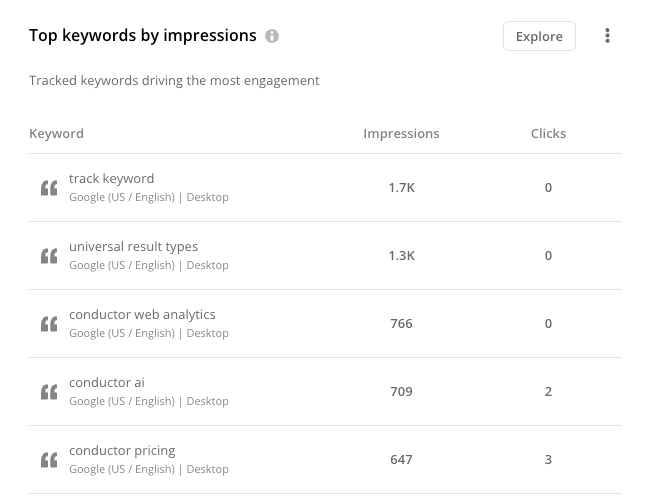
Two tables break down where your engagement comes from:- Top keywords by impressions lists the keywords driving the most engagement, with their impressions and clicks.
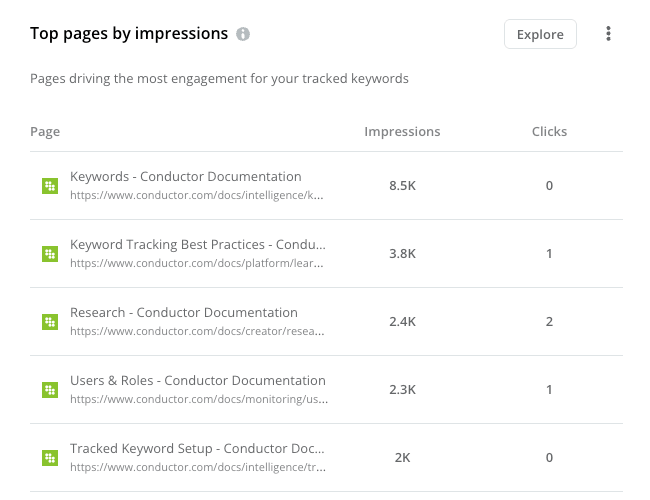
- Top pages by impressions lists the pages driving the most engagement, with their impressions and clicks.
Research and act on keywords from the Explore table
Click Explore on either table to see the full list for your selected scope. When you explore your top keywords, use the three-dot menu next to any keyword to act on it:- For a keyword you don’t track yet, select Start tracking to add it to your tracked keywords. This is an easy way to turn the queries you discover in All GSC keywords into part of your keyword strategy.
- For a keyword you already track, you can Set preferred URL, Set as prime, Edit keyword group membership, open its Keyword details report, or Stop tracking it.
Review the Keywords table
Choose the Columns to display
Use the Columns menu to select the columns you want to see.
- MSV (All Devices) Indicates the monthly search volume for this keyword.
-
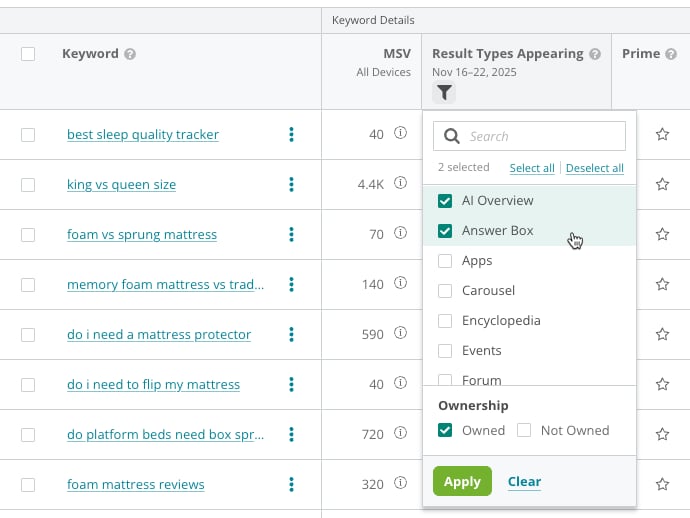
Result Types Appearing ([Most-recent time period])
Result types refer to any non-standard results that appear on the search engine results page, such as answer boxes, products, and images. Owned results are highlighted in green. In addition to choosing the result types you want to view, you can use the column filter to choose to see only Owned, only Not Owned, or both.
- Prime Indicates which keywords have been marked Prime.
- KW Groups Indicates the keyword group or groups the keyword belongs to.
- Tracking Indicates whether Conductor is tracking the keyword weekly (the default frequency) or daily.
- Rank ([first time period]) Indicates the keyword’s rank during the first time period reported on.
- Rank ([second time period]) Indicates the keyword’s rank during the second time period reported on.
- Rank Change Indicates the difference between the rank reported on in the first and second time periods.
- Result Type ([first time period]) Indicates the universal result types for the highest ranked result from your website during the first time period reported on.
- Result Type ([second time period]) Indicates the universal result types for the highest ranked result from your website during the second time period reported on.
- URL Change Indicates whether your web property’s highest-ranked result for the keyword has changed between the first and second time period you are reporting on.
- Highest Ranking Page Indicates the URL associated with your website’s highest-ranked result for the keyword.
- No. of Results Indicates the number of pages from your website that rank for the keyword. You can use this to find keywords you own lots of results for and issues where your pages may be cannibalizing each other.
- Impressions (first time period) and Impressions (second time period) This value is the total number of times results for pages on your website appeared to a user on a search engine results page for the tracked keyword.
- Change in Impressions The difference in Impressions between the two time periods you are reporting on.
- Clicks (first time period) and Clicks (second time period) This value is the total number of times users clicked results for pages on your website when it appeared on a search engine results page.
- Change in Clicks The difference in clicks between the two time periods you are reporting on.
- CTR (first time period) and CTR (second time period) CTR is click-through rate. This value is a ratio derived from the Clicks metric divided by the Impressions metric.
- Change in CTR The difference in click-through rate between the two time periods you are reporting on.
- Preferred URL Indicates the preferred URL configured for the keyword.
- Is Highest Ranking This indicates whether the preferred URL is also your website’s top ranking URL for this keyword.
Filter columns in the table
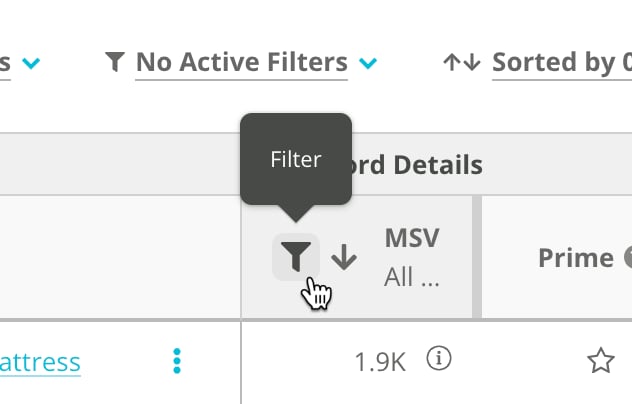
You can use column filters to report on areas of focus. You can also save your filters with a custom view for use later.- Hover over a column header to find filter icon shown here.
- KW Groups (this can be filtered using Keyword Groups menu in the report header)
- Tracking
- Preferred URL
- Use the filter to configure the criteria that determine what data should appear in the column.
- Click Apply.
Review the data in the table
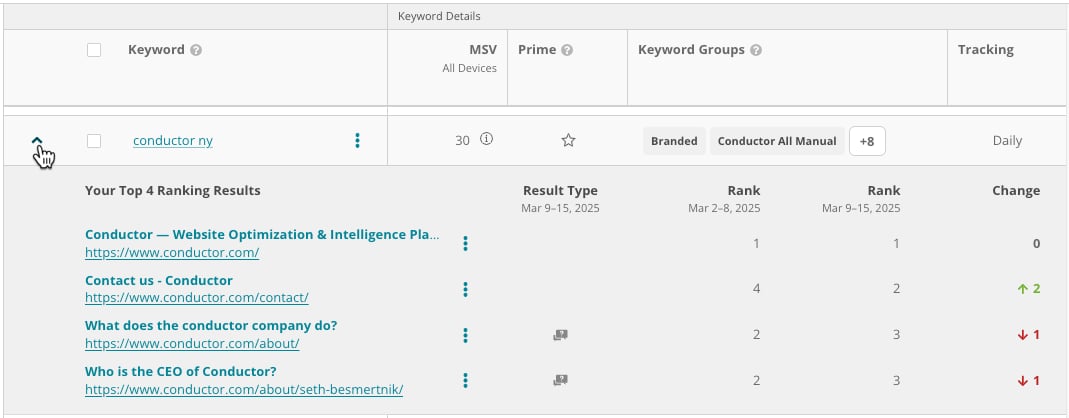
- To review up to five of your pages ranking for a tracked keyword, click the caret to open a fly-out menu for each keyword:
- To investigate a particular keyword, click its name in the Keyword column to go to its Keyword Details report.
- To report on the data you are reviewing with other data from across Conductor Intelligence, add it as a widget to a workspace (Share > Add to Workspace).
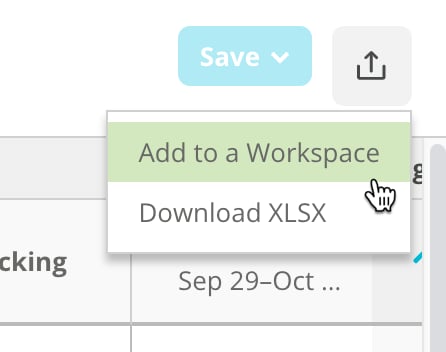
Export your keywords
The export feature on this report is one of the most commonly-used exports in Conductor. You can export a list of all your tracked keywords to a native Microsoft Excel file. With this data in Excel, you can filter, sort, and manipulate your keywords to gain greater clarity, as well as merge other sources of data with your keyword list.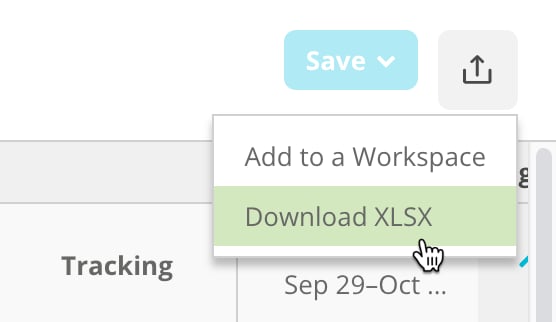
Manage your keywords
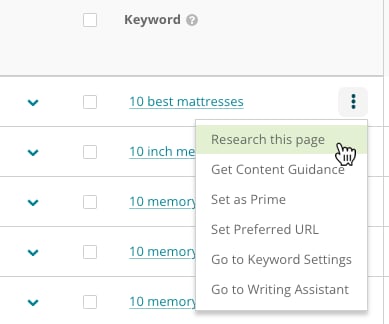
For individual keywords
You can use the three-dot menu next to each keyword in the Keywords table to perform a number of keyword management actions, including:- Research the keyword
- Get Content Guidance
- Add or Remove Prime
- Set Preferred URL
- Go to Keyword Settings
- Go to Writing Assistant
For multiple keywords
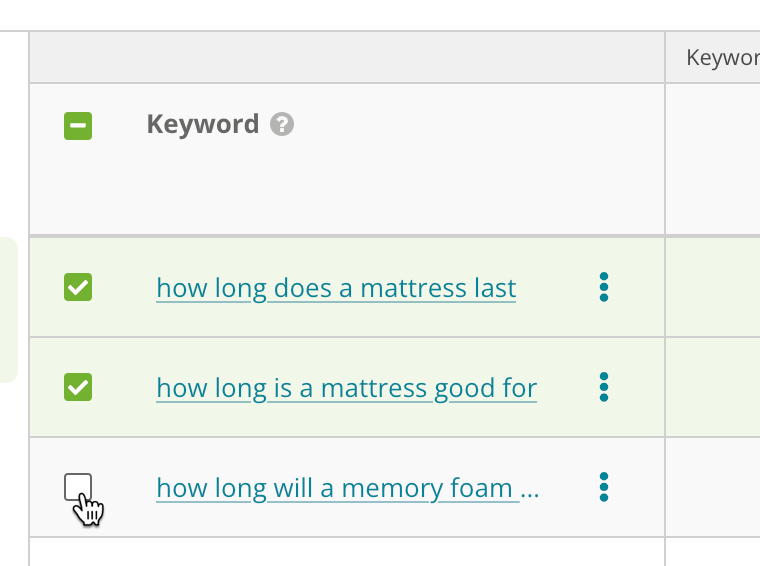
You can update multiple tracked keywords in bulk using the Actions menu above the Keywords table.- Select two or more keywords in the table.
- Use the Actions menu to select how you want to manage the keywords you selected above.
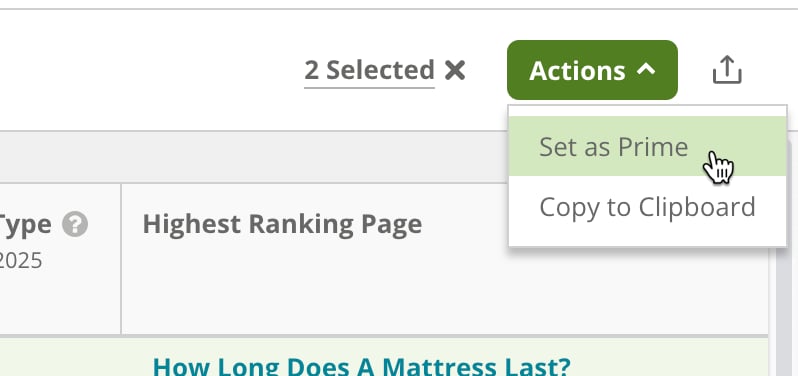
- Prime status.
- Copy to Clipboard.
- Research the keywords.
- Get Content Guidance.
- Add to Writing Assistant.
If you want to manage the settings for many keywords at once, consider using the keyword bulk update tool.
Using keywords
- Use keywords rank to identify opportunities
- Identify the topics that you might be losing ranks for—and causing lost traffic
- Determine whether you were affected by a Google algorithm update
- Monitor your content’s search performance
- Find content gaps across the customer journey with keyword groups
- Building an executive report
- Create a standard workspace to use across departments
- Track and monitor search performance of offsite content like guest posts