Learn about the new Pages and Page Details reports!
Pages
You can measure how your pages are performing in the Pages report. Review your site’s performance for your integrated metrics, across different views, such as Year-over-Year and Metric Comparison—or filtered by page group. Then focus on the specific pages on your site that are driving your results.
Conductor reports on your top 10,000 pages (or 100,000 pages, if you have upgraded) with organic traffic each week in the Pages report. Remember, all data in this report reflects only organic traffic.
The legacy Pages report no longer has its own item in the navigation. Open it from the new Pages report instead.
Overview
Determine the Reporting Time Period
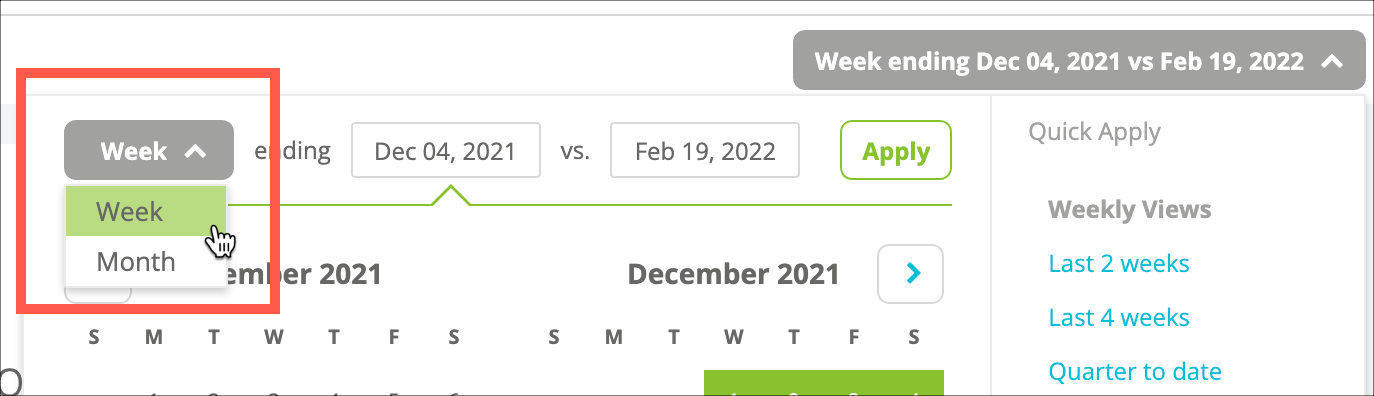
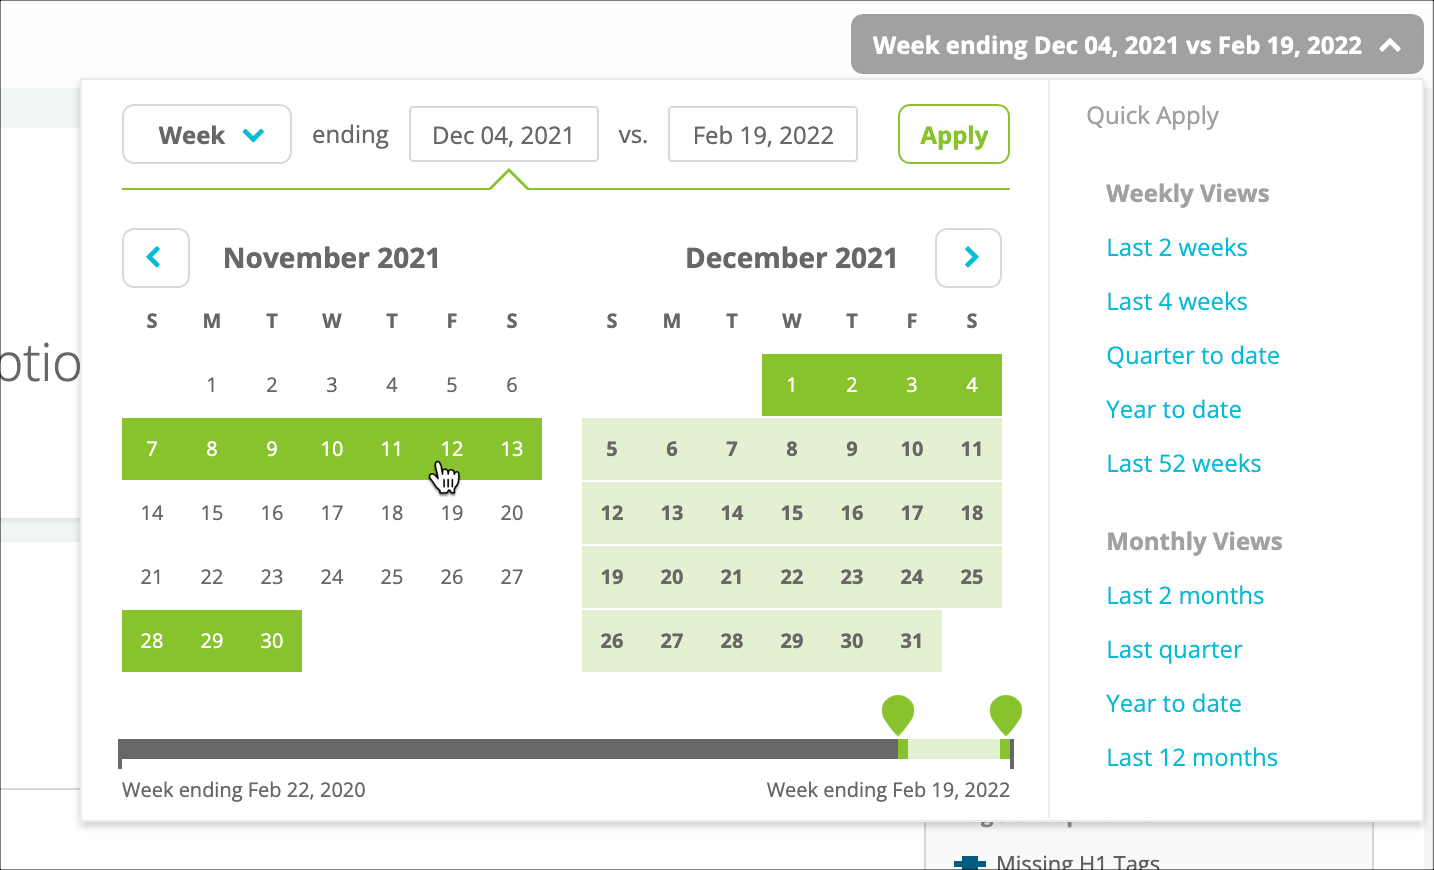
Select the time periods you want to report on and the granularity (weekly or monthly data). You can select to see historic data from up to 24 months.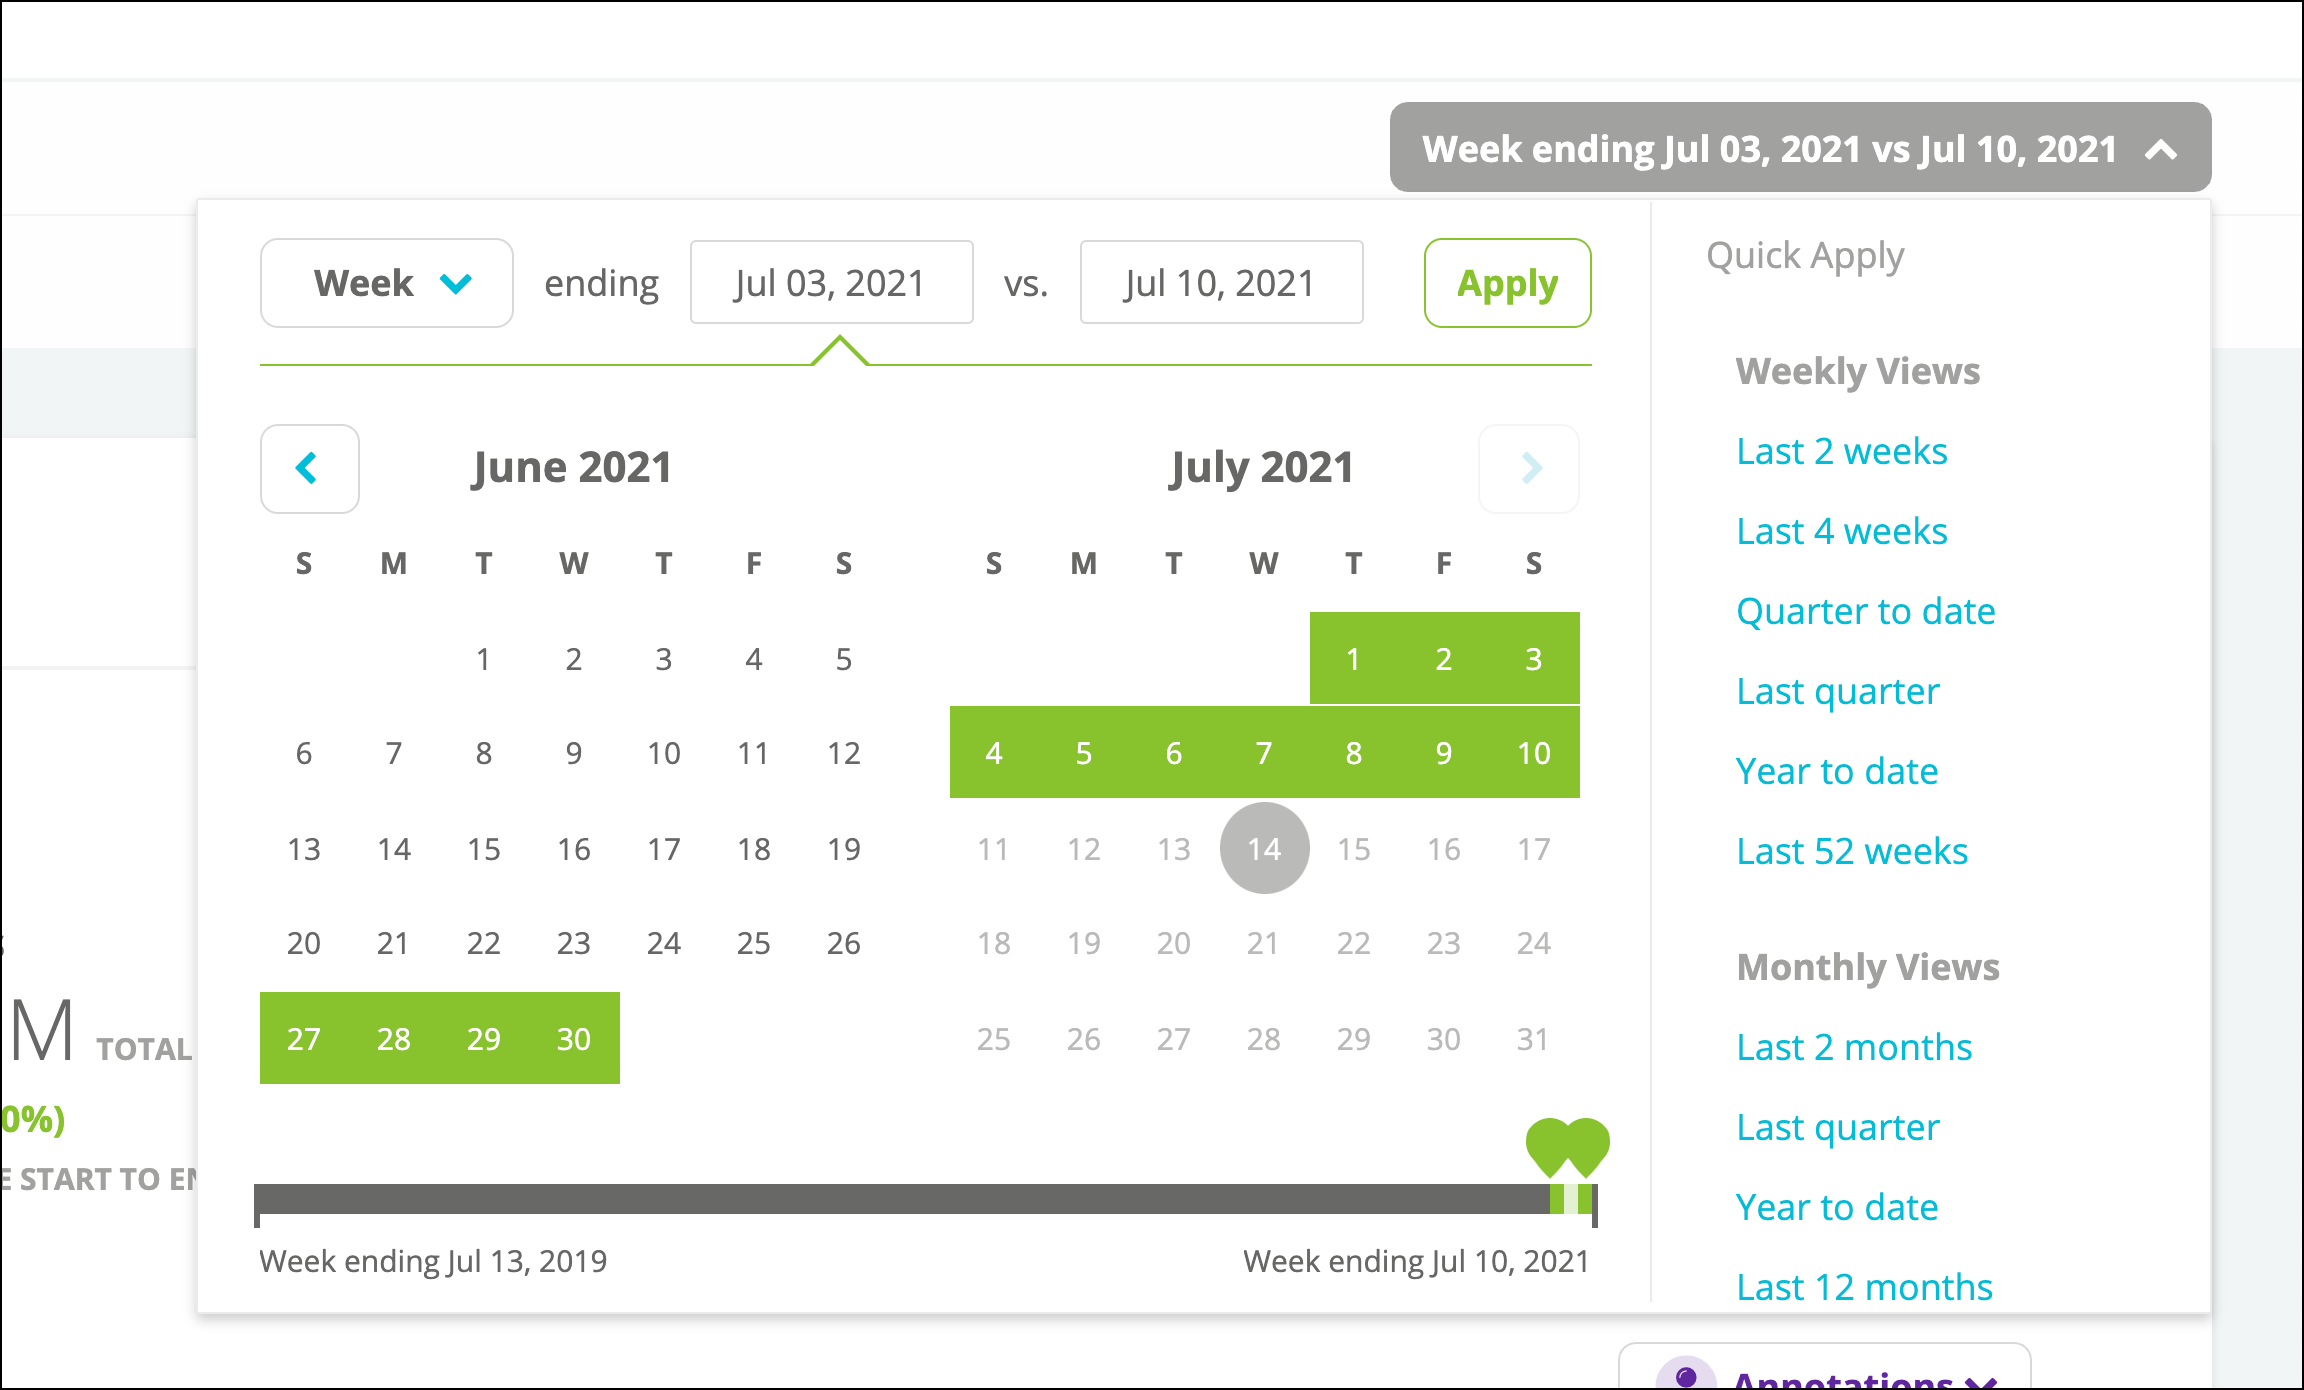
Determine the Scope of the Chart and Table
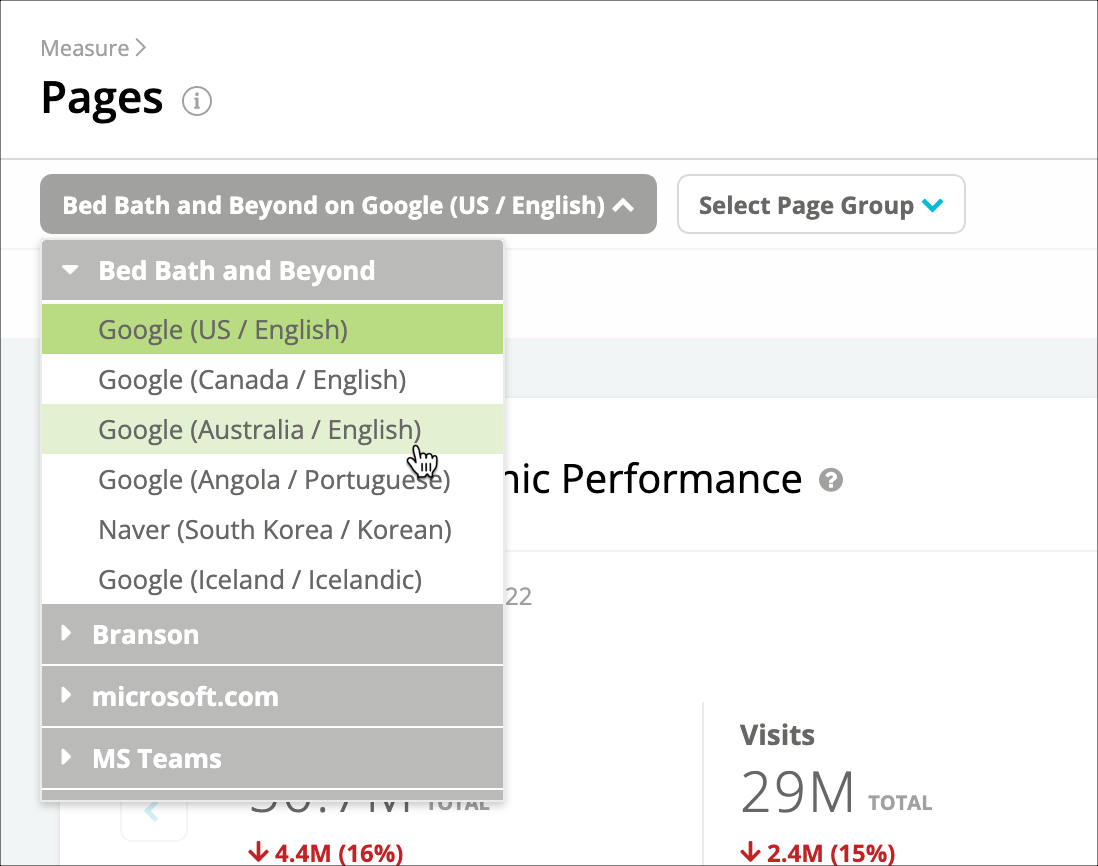
Configure the following controls to determine what data the Pages report includes:- Select a web property from the menu of your configured web properties.
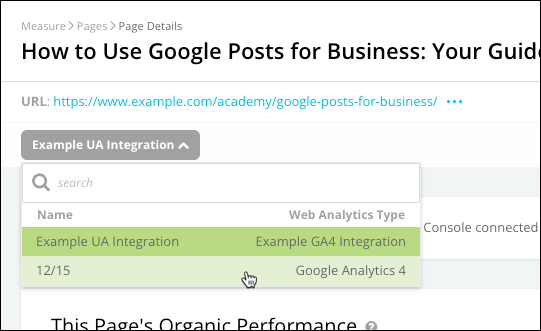
- If you have multiple analytics integrations configured for the web property you chose above, select the integration you want to see data from.
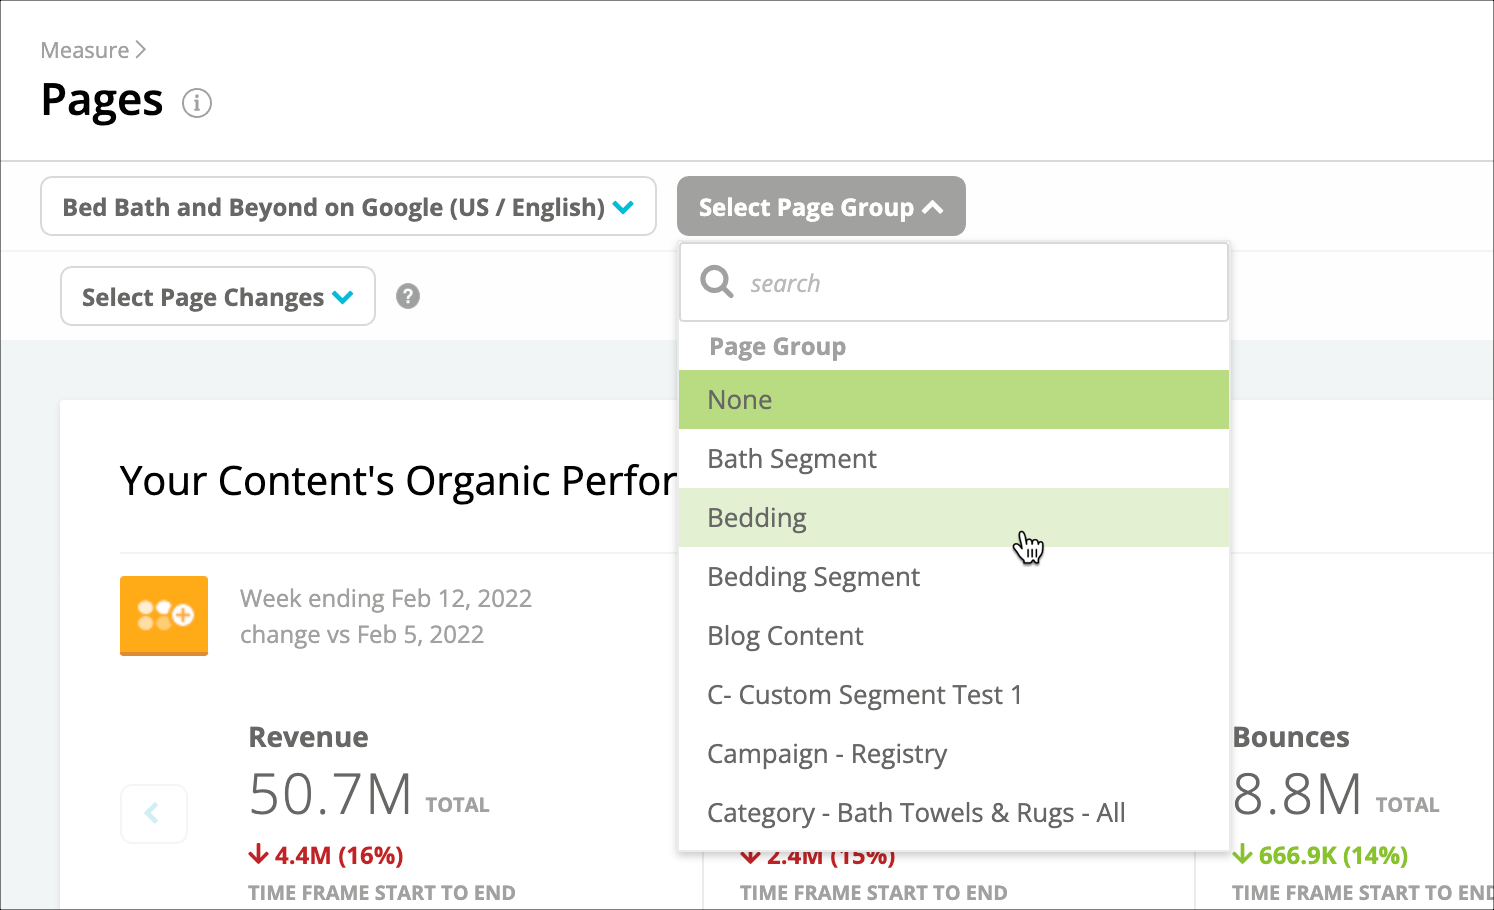
- From the Select Page Group filter, choose a page group if you want to focus on a particular subset of pages on your site.
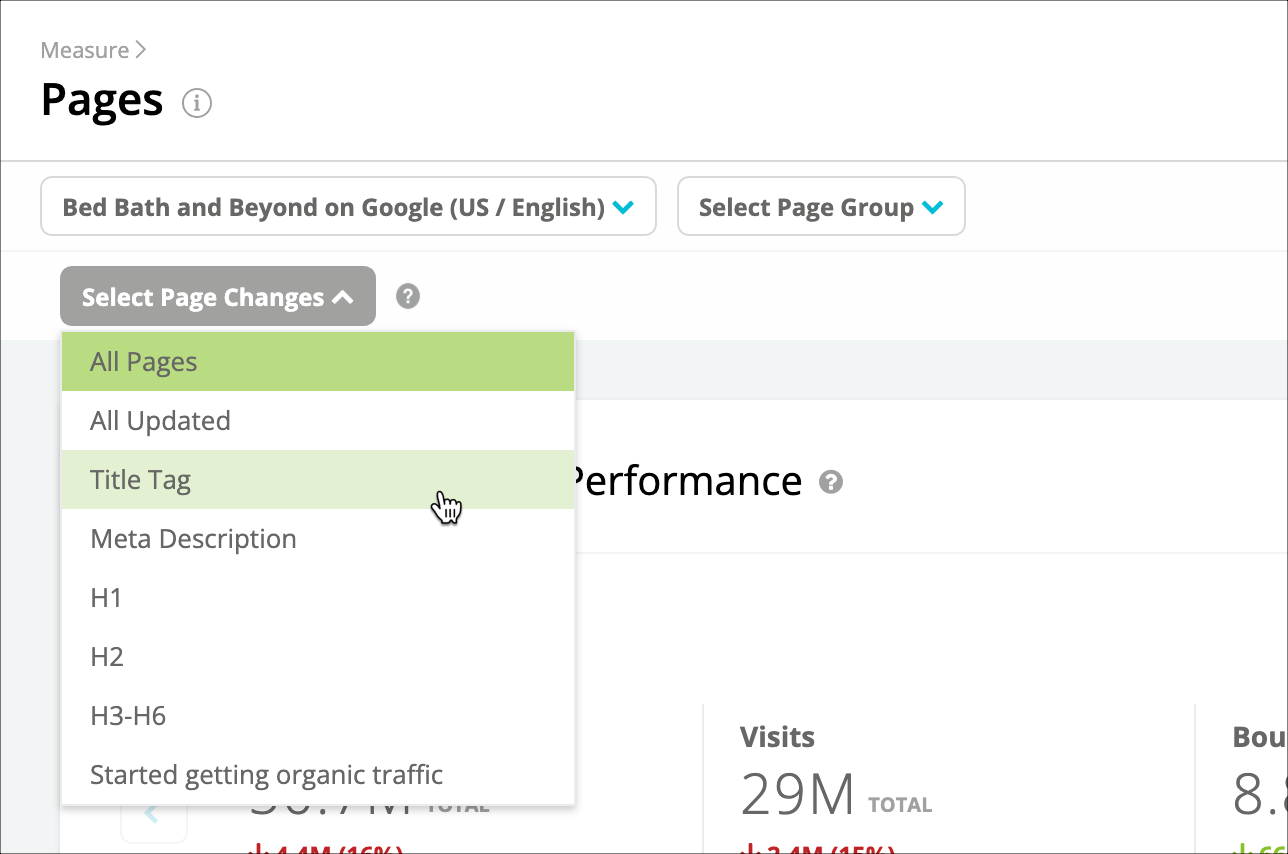
- Select whether to filter the report to show newly discovered or updated pages over a specific time period. Refer to the Annotations article for more guidance about using this control.
Review Your Organic Performance
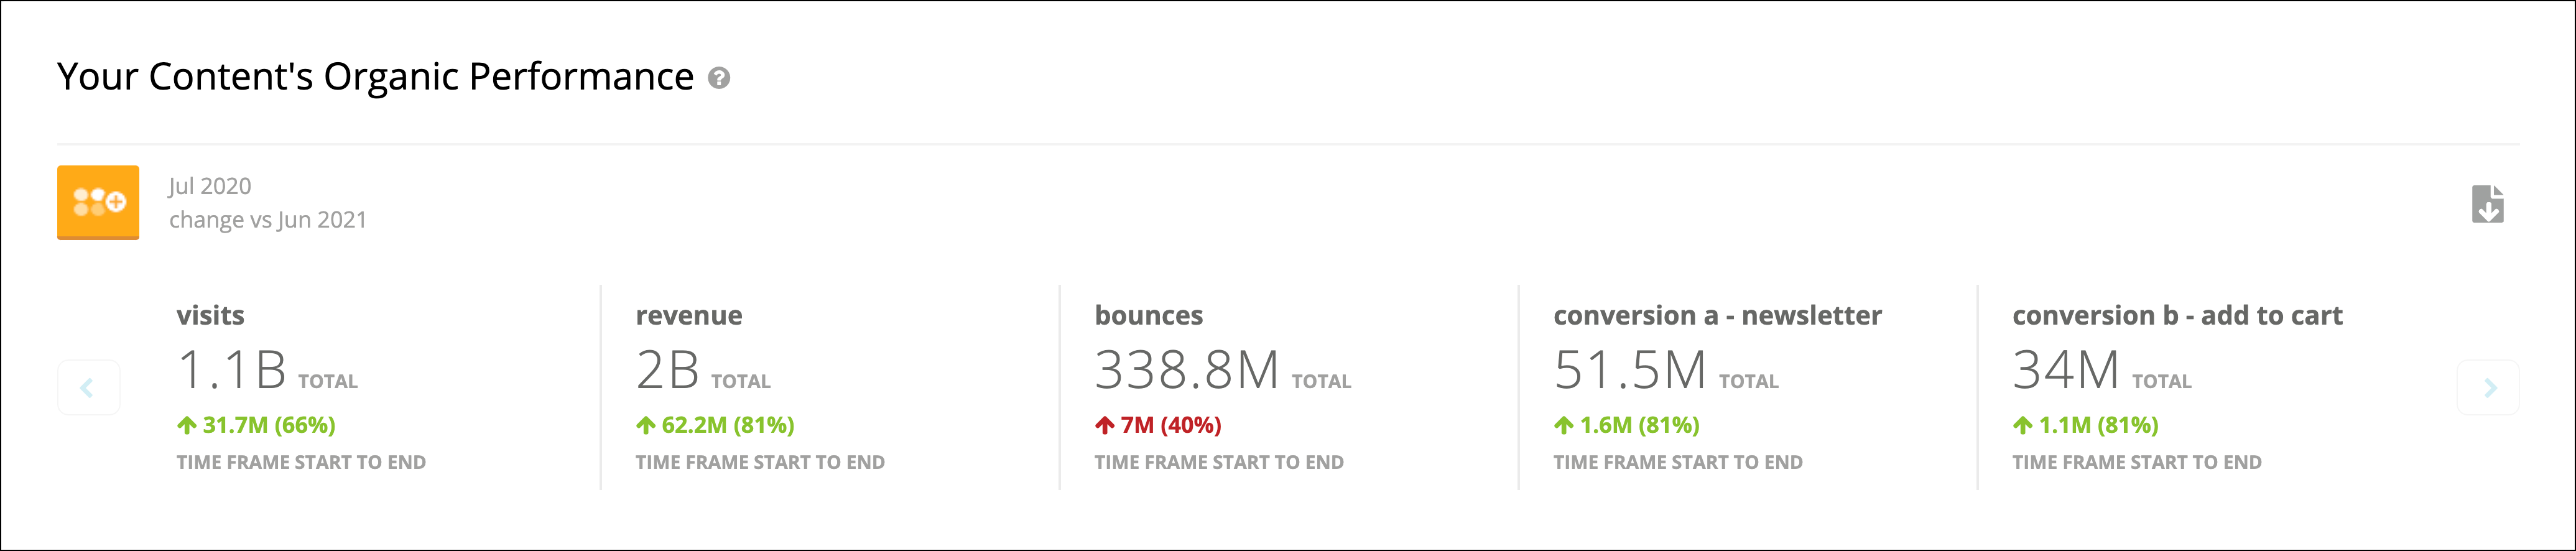
- At the top of the report, you’ll see a Summary bar of your performance for each of your integrated metrics across your reporting time period.
- In the chart below, you can see how your site has performed over time. You can use the following selector to choose to review data from the views listed below:
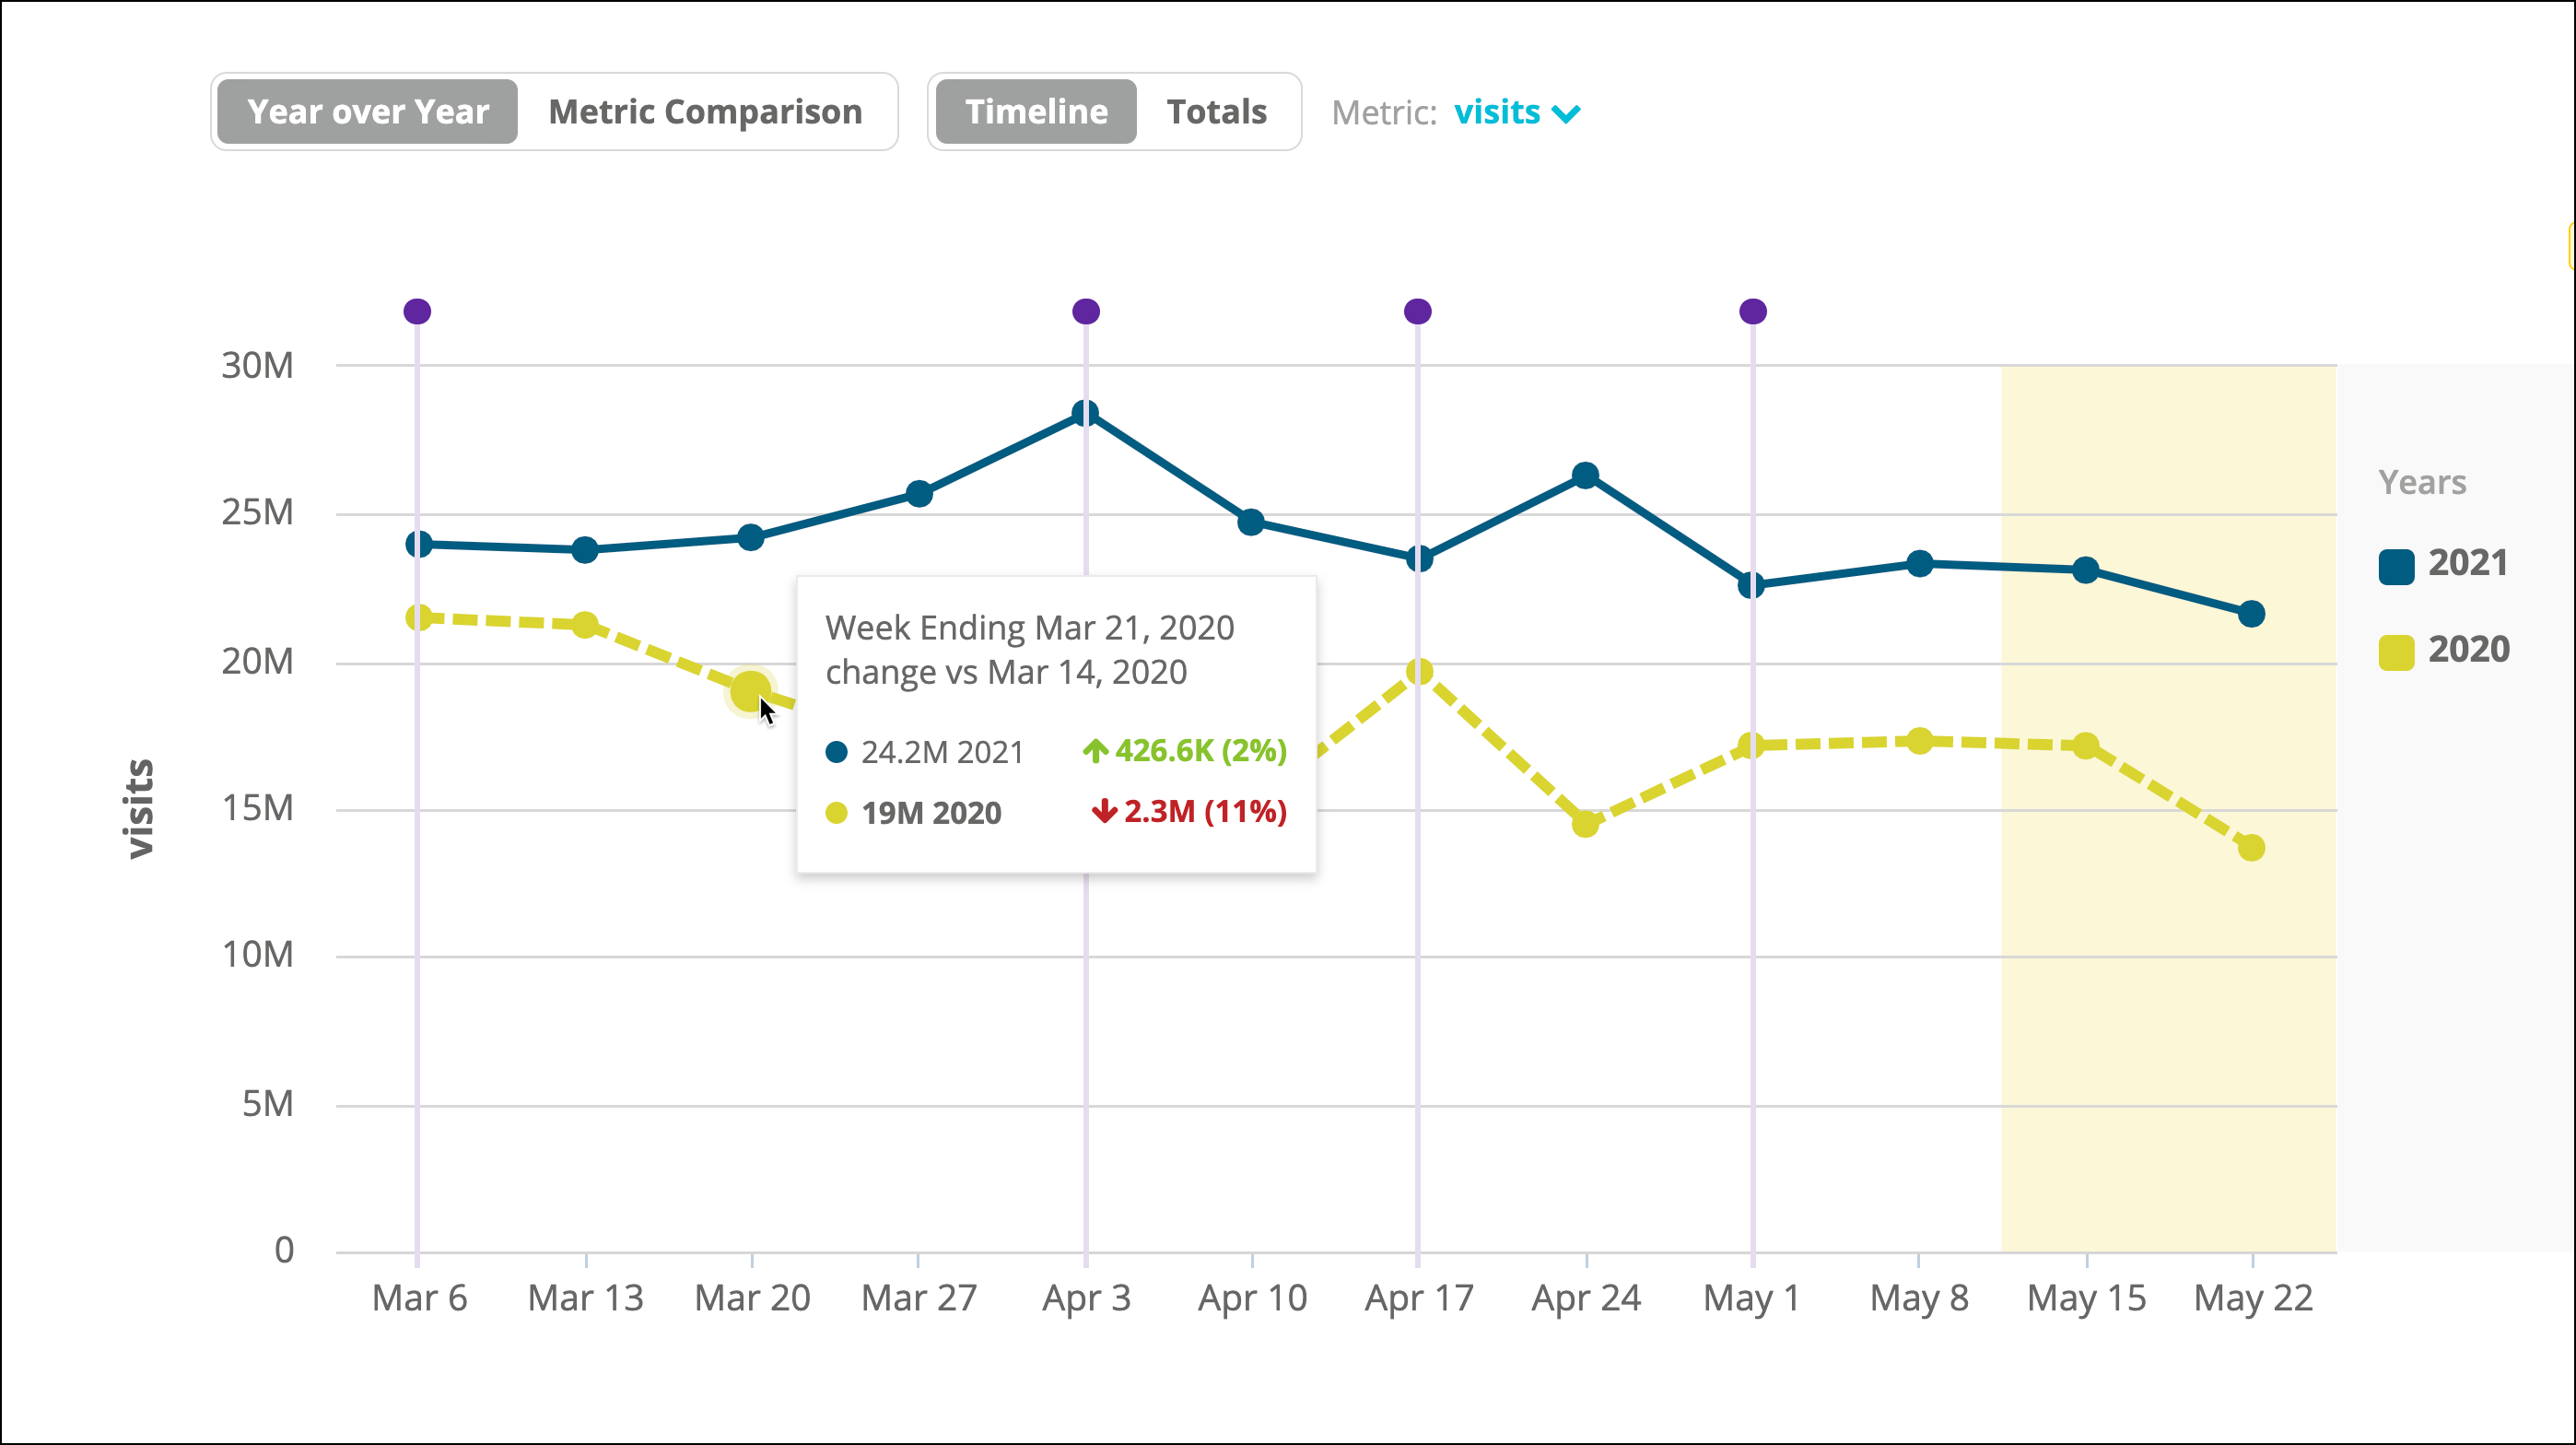
- Year over Year
Select the metric you want to review data for:Then see how your performance for a specific metric compares to previous years’ performance.**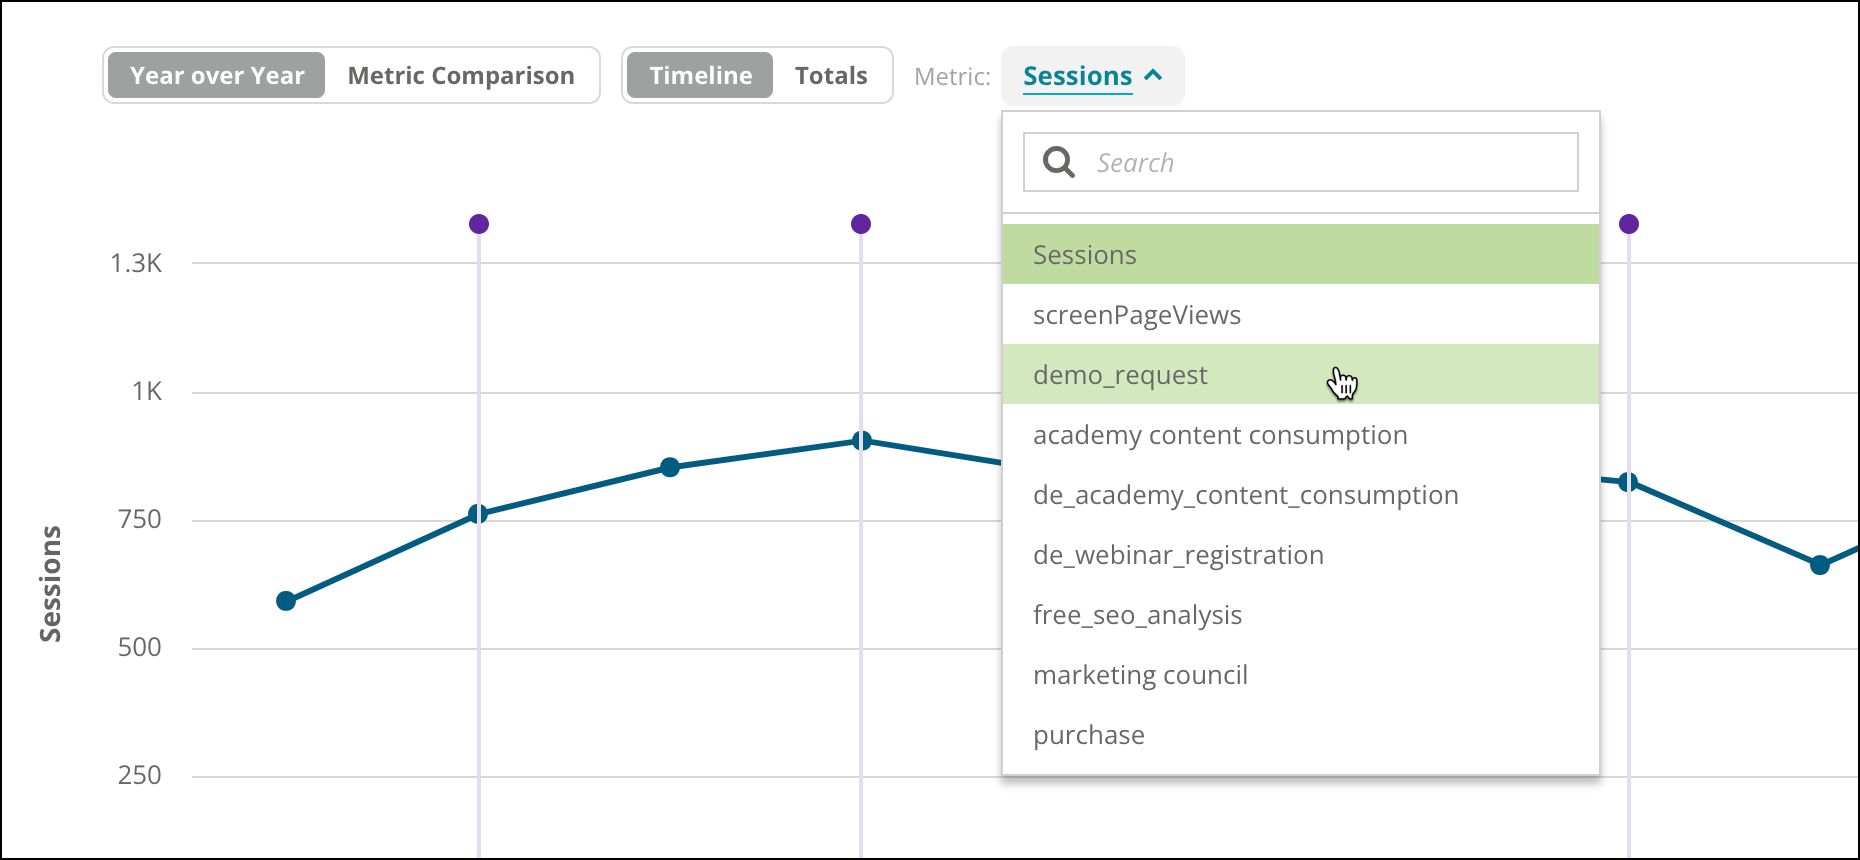
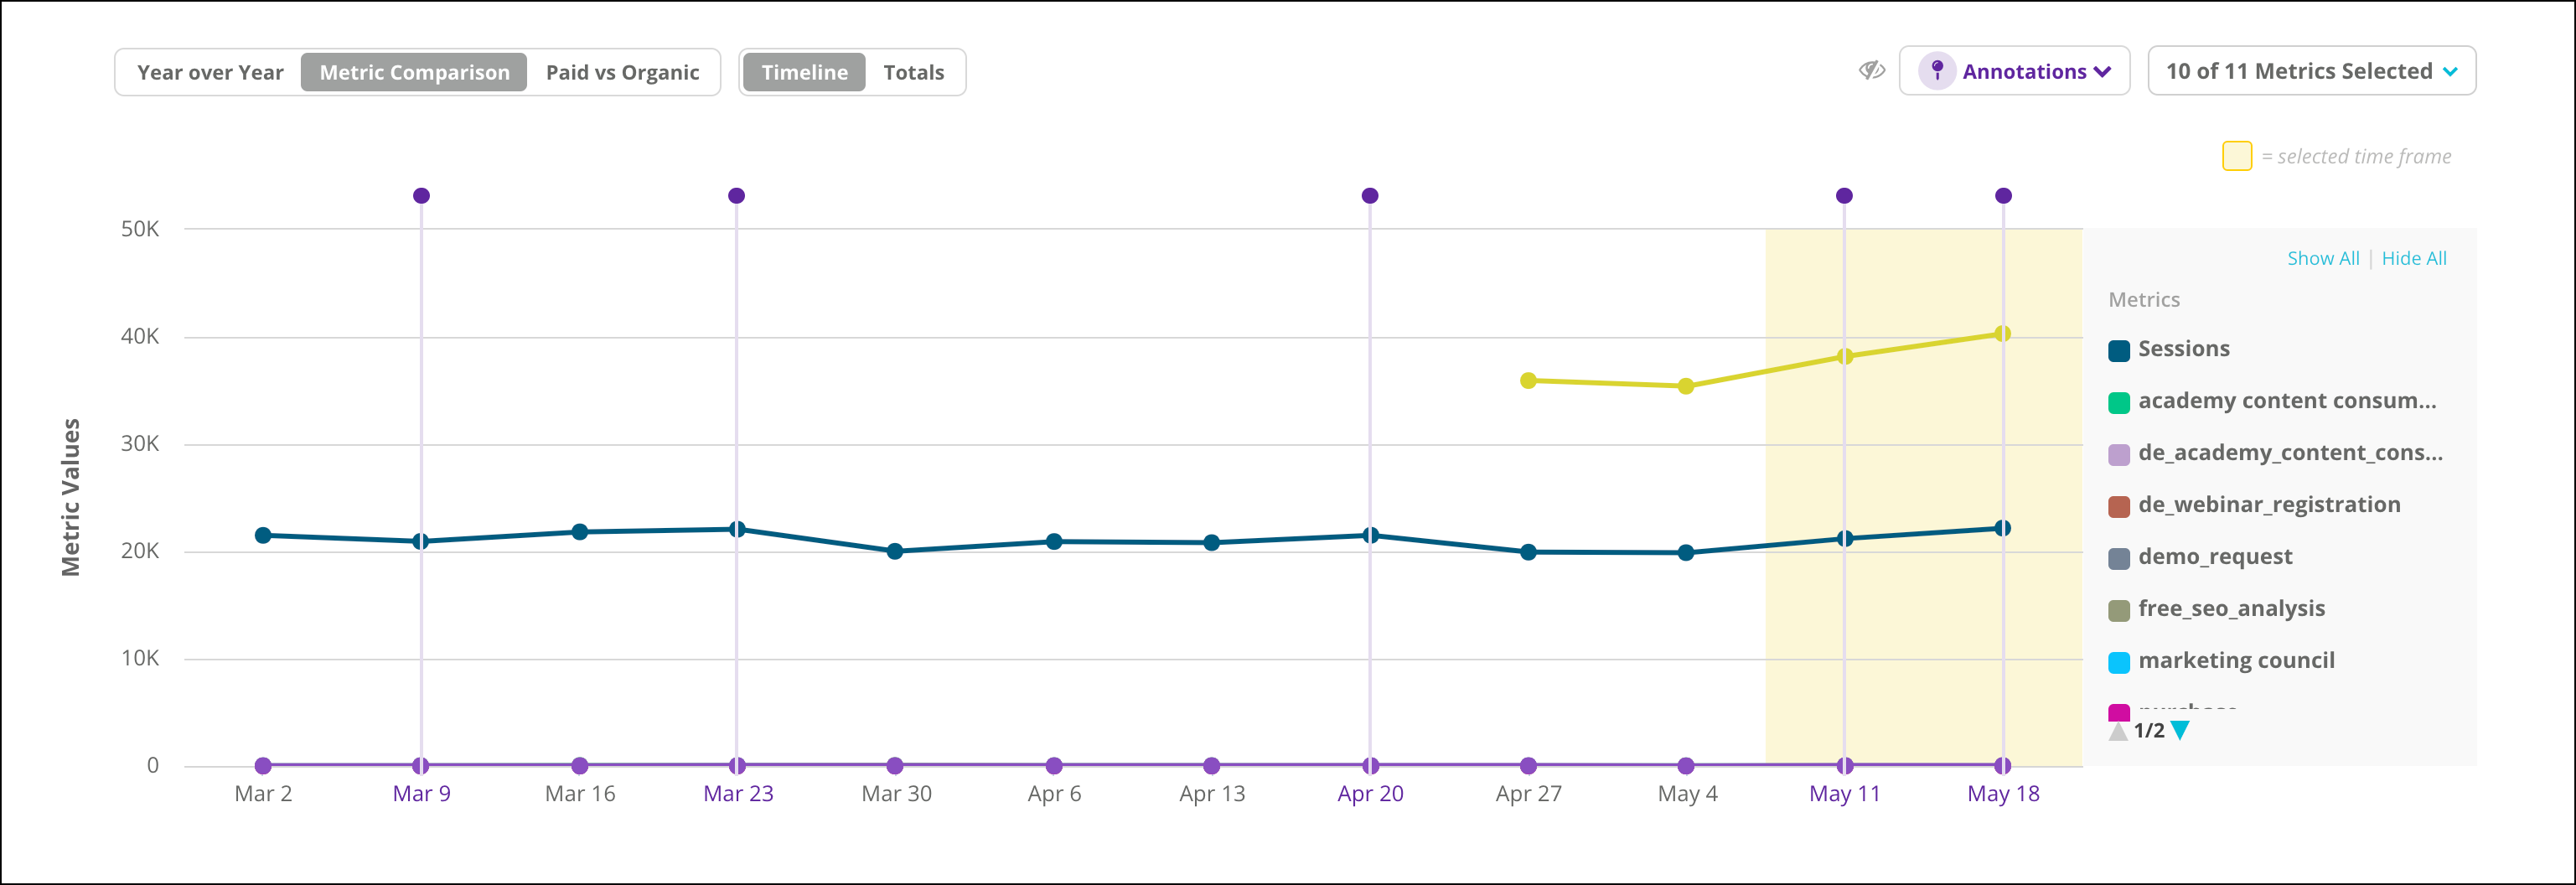
- Metric Comparison
Select the metrics you want to compare:Then quickly see how your integrated metrics stack up.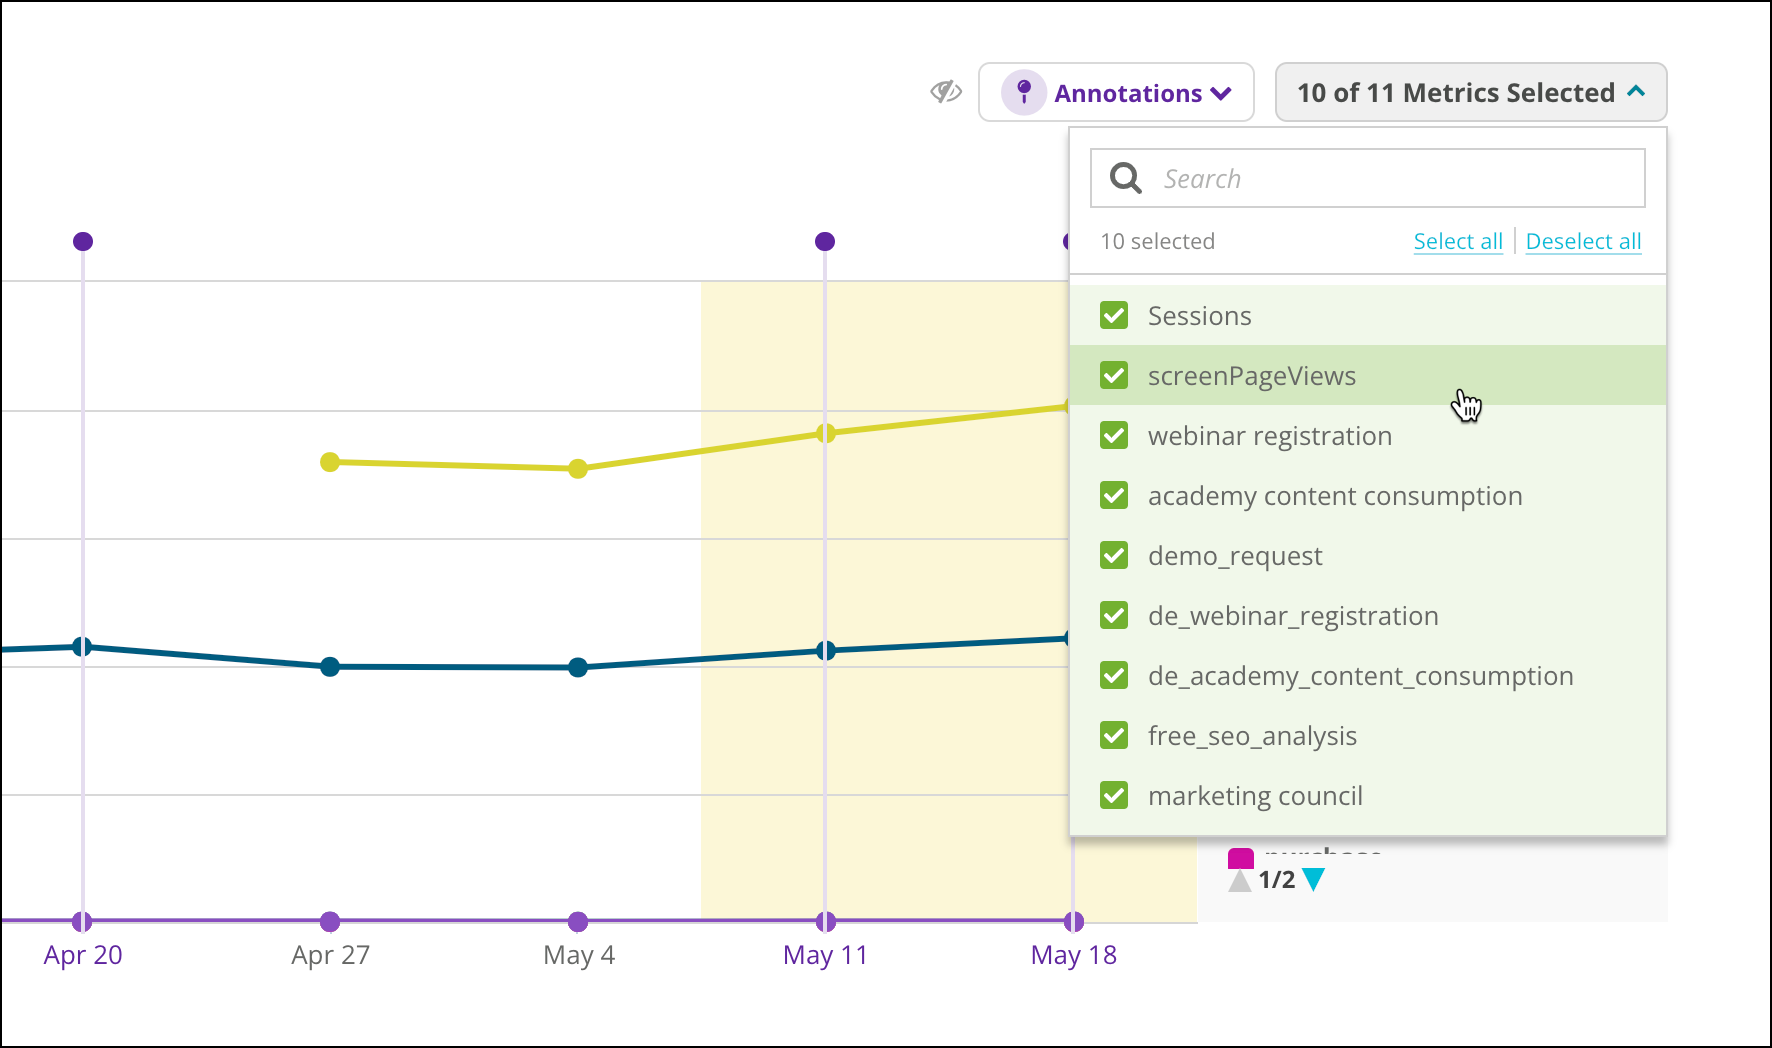
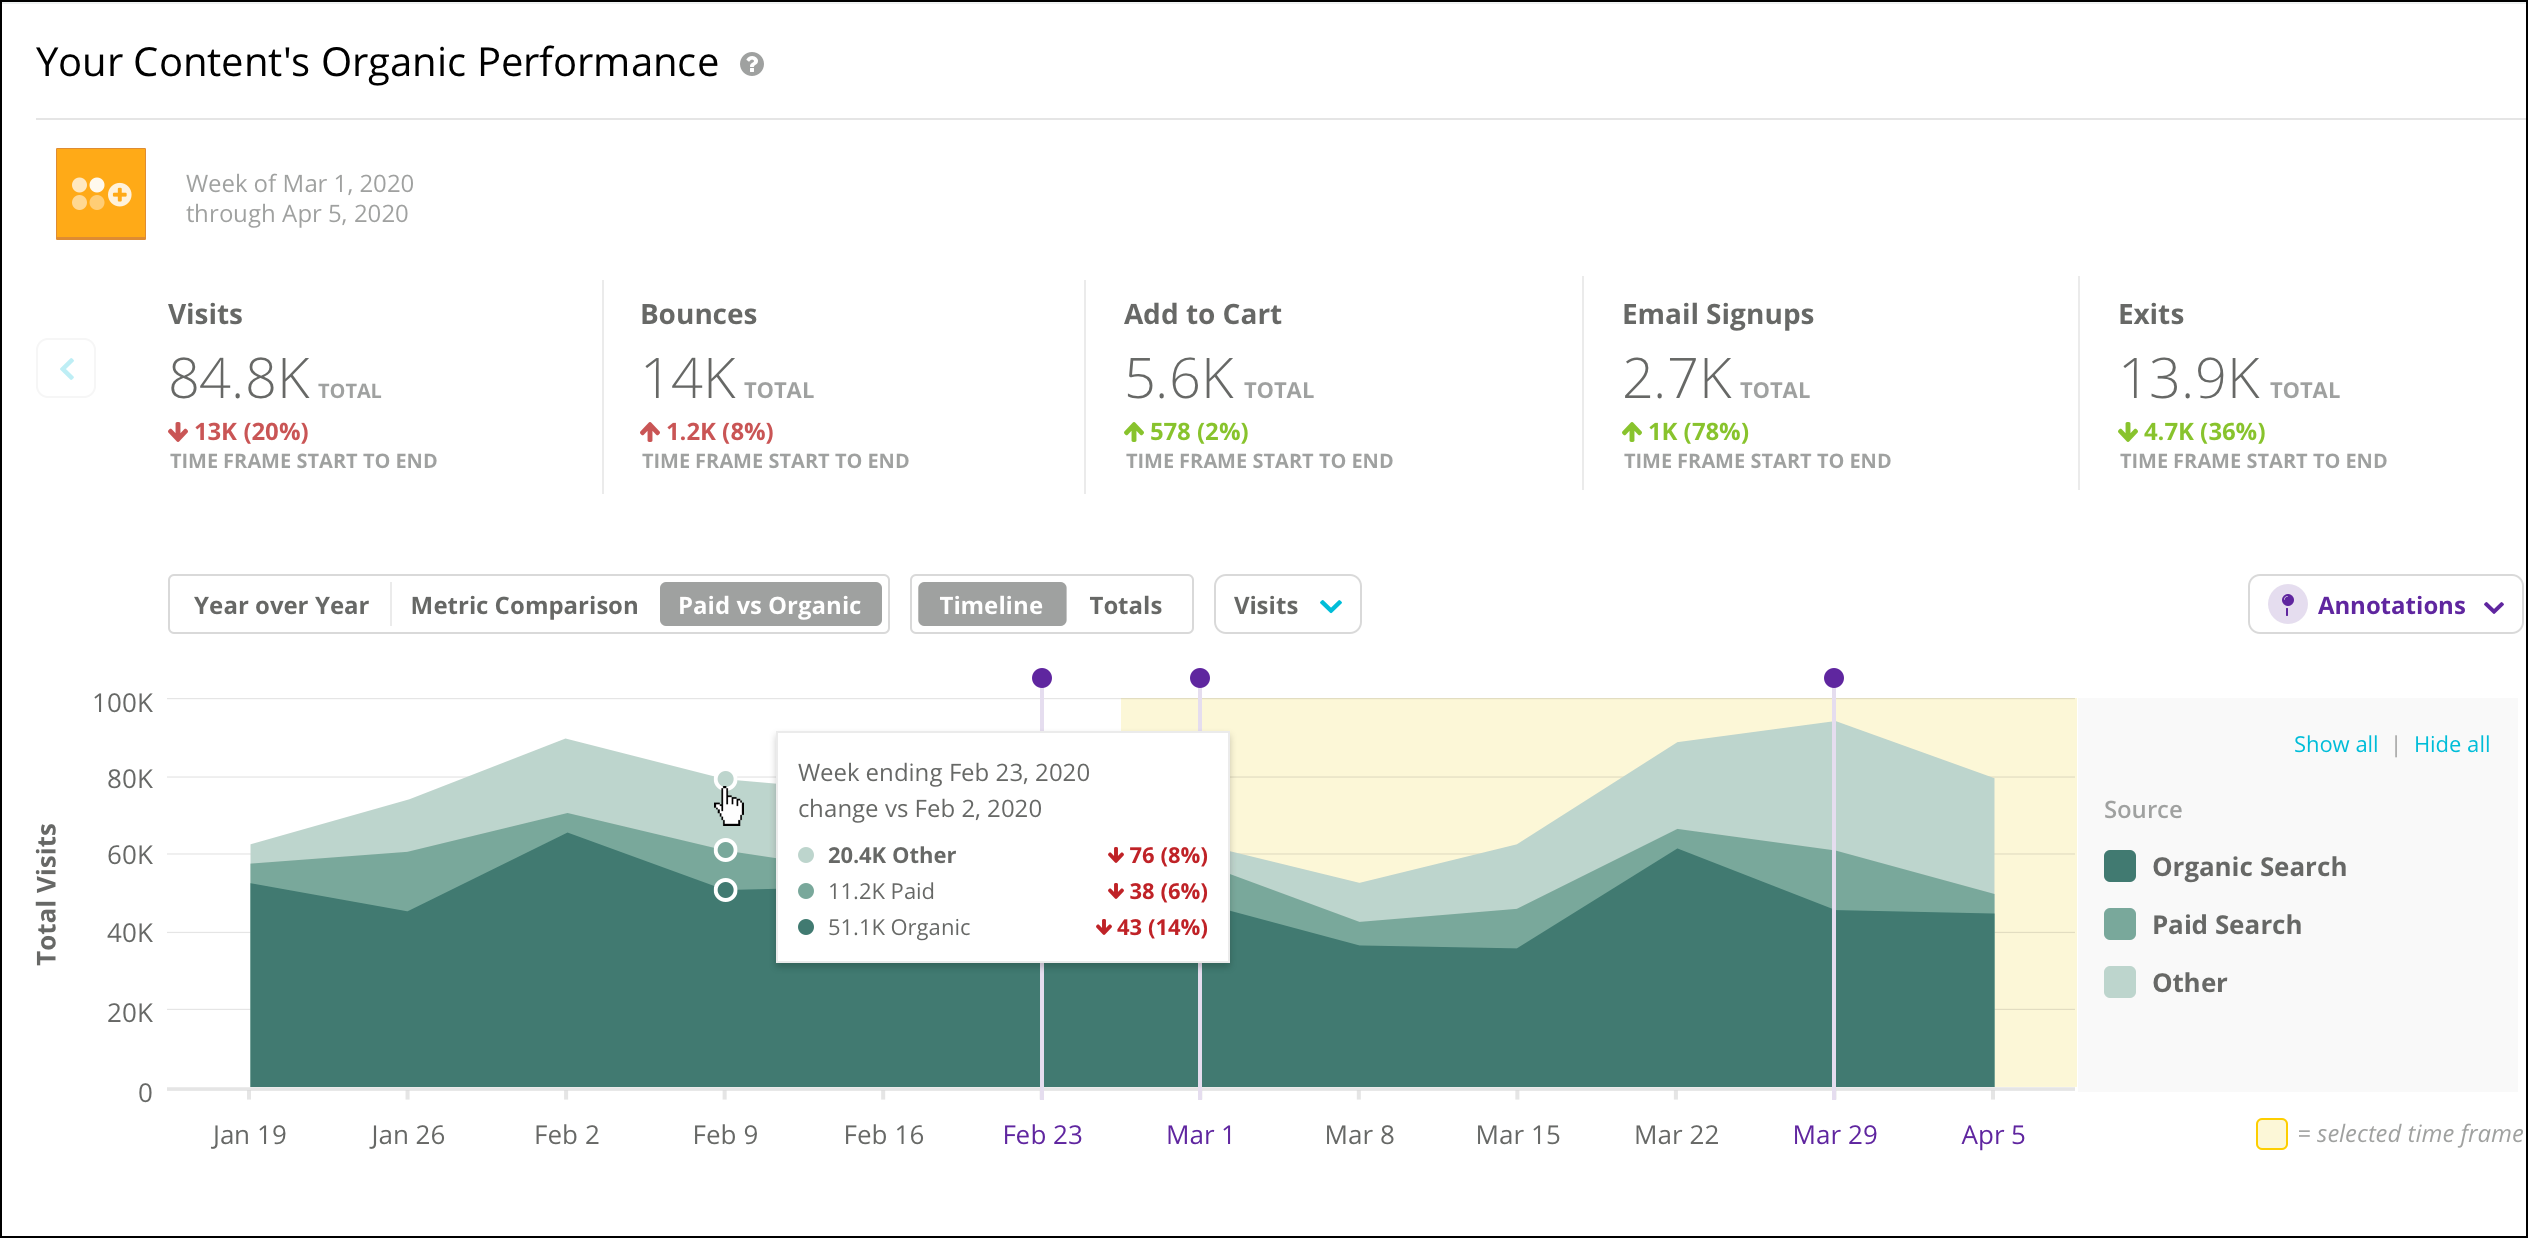
- Paid vs Organic
See your organic traffic compared with the paid—and total—traffic to your site. Note that choosing this view will adjust the data shown in the summary bar to reflect all your domain’s organic analytics data, not just your top 10,000 (or 100,000, if upgraded). Refer to this article to learn more.
Note:- Any traffic that comes from a source other than Paid or Organic search (such as Direct, Social, Referral, etc.) is grouped under the Other category.
- The Other category is not available for Adobe Analytics integrations.
- Year over Year
- For any of the views listed above, you can use the following selector to determine whether you want to see this data over a Timeline or as Totals:
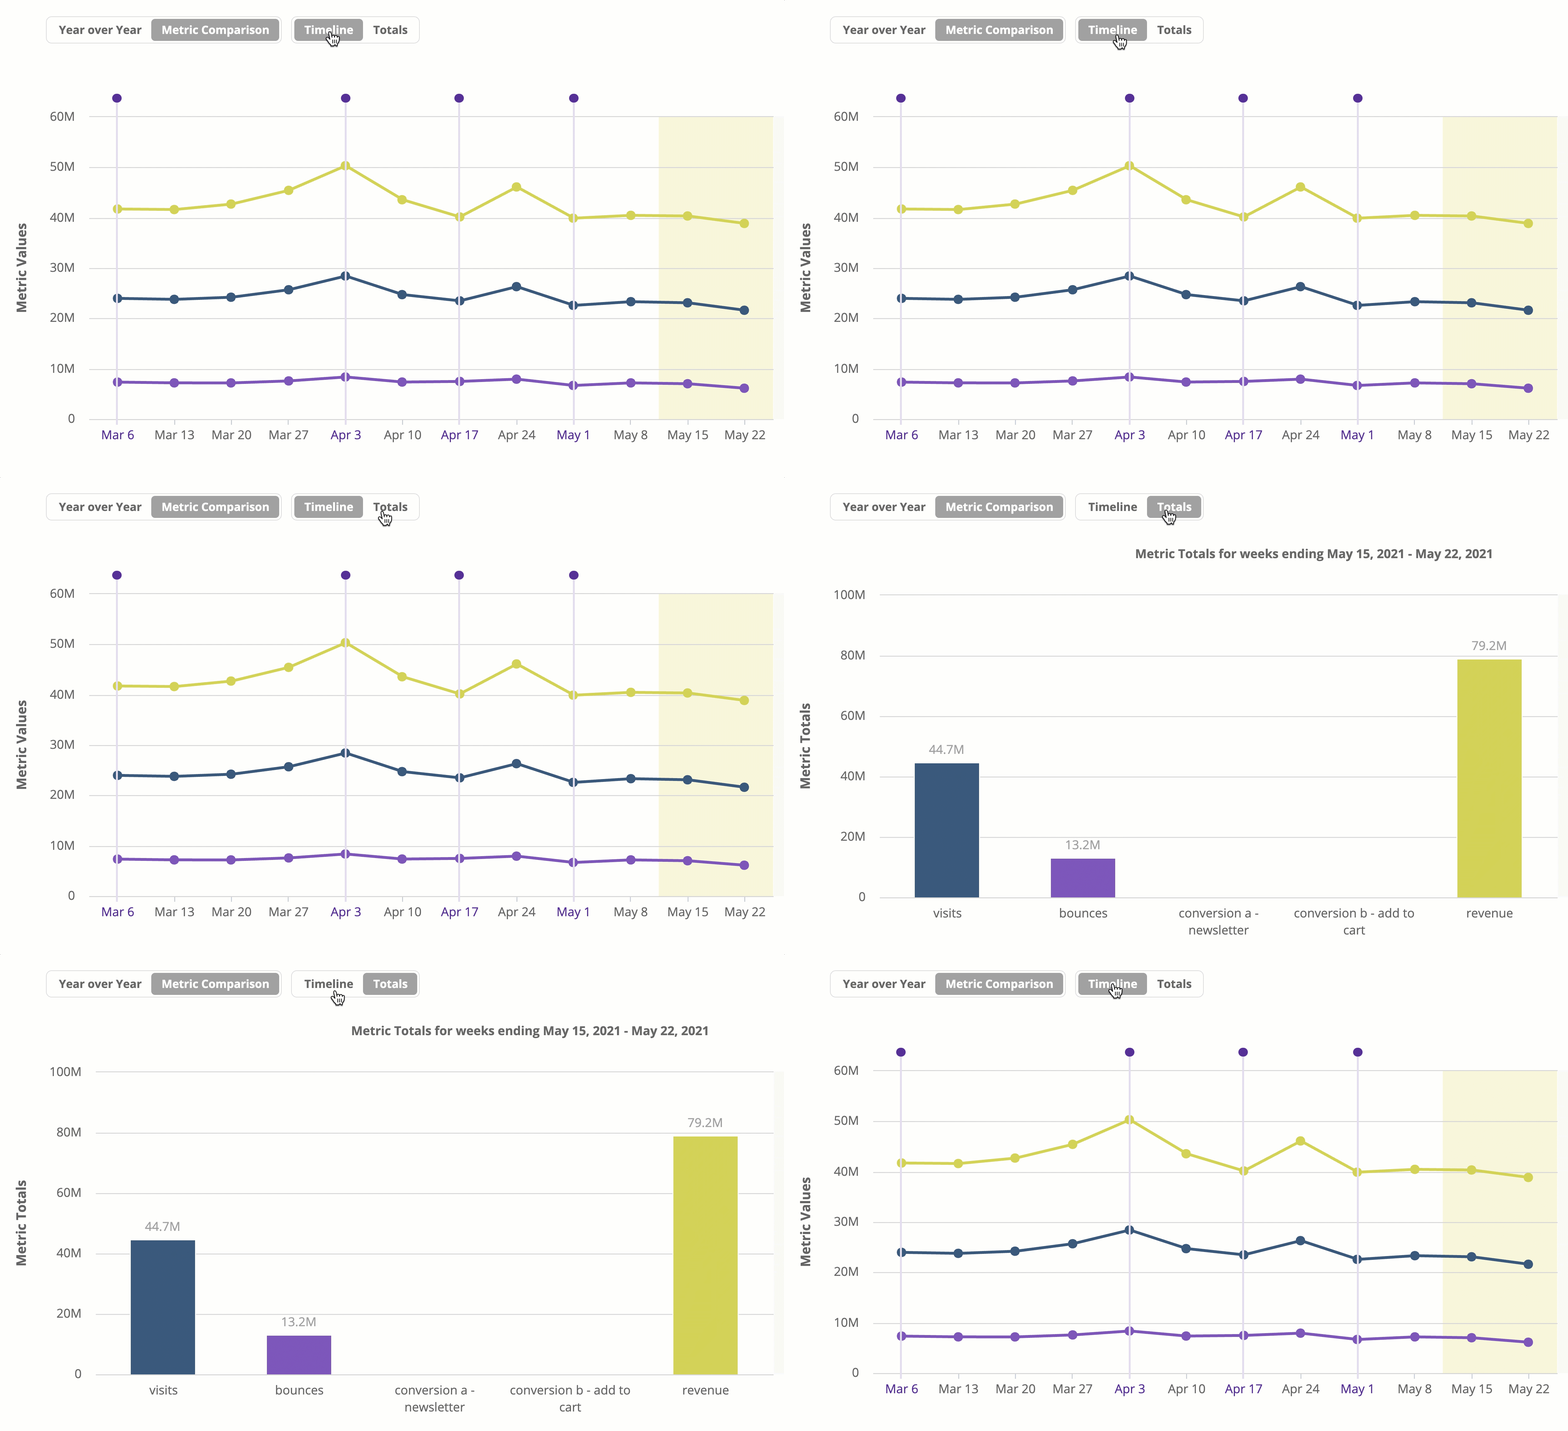
- Review any Annotations. These annotations appear as purple pins:
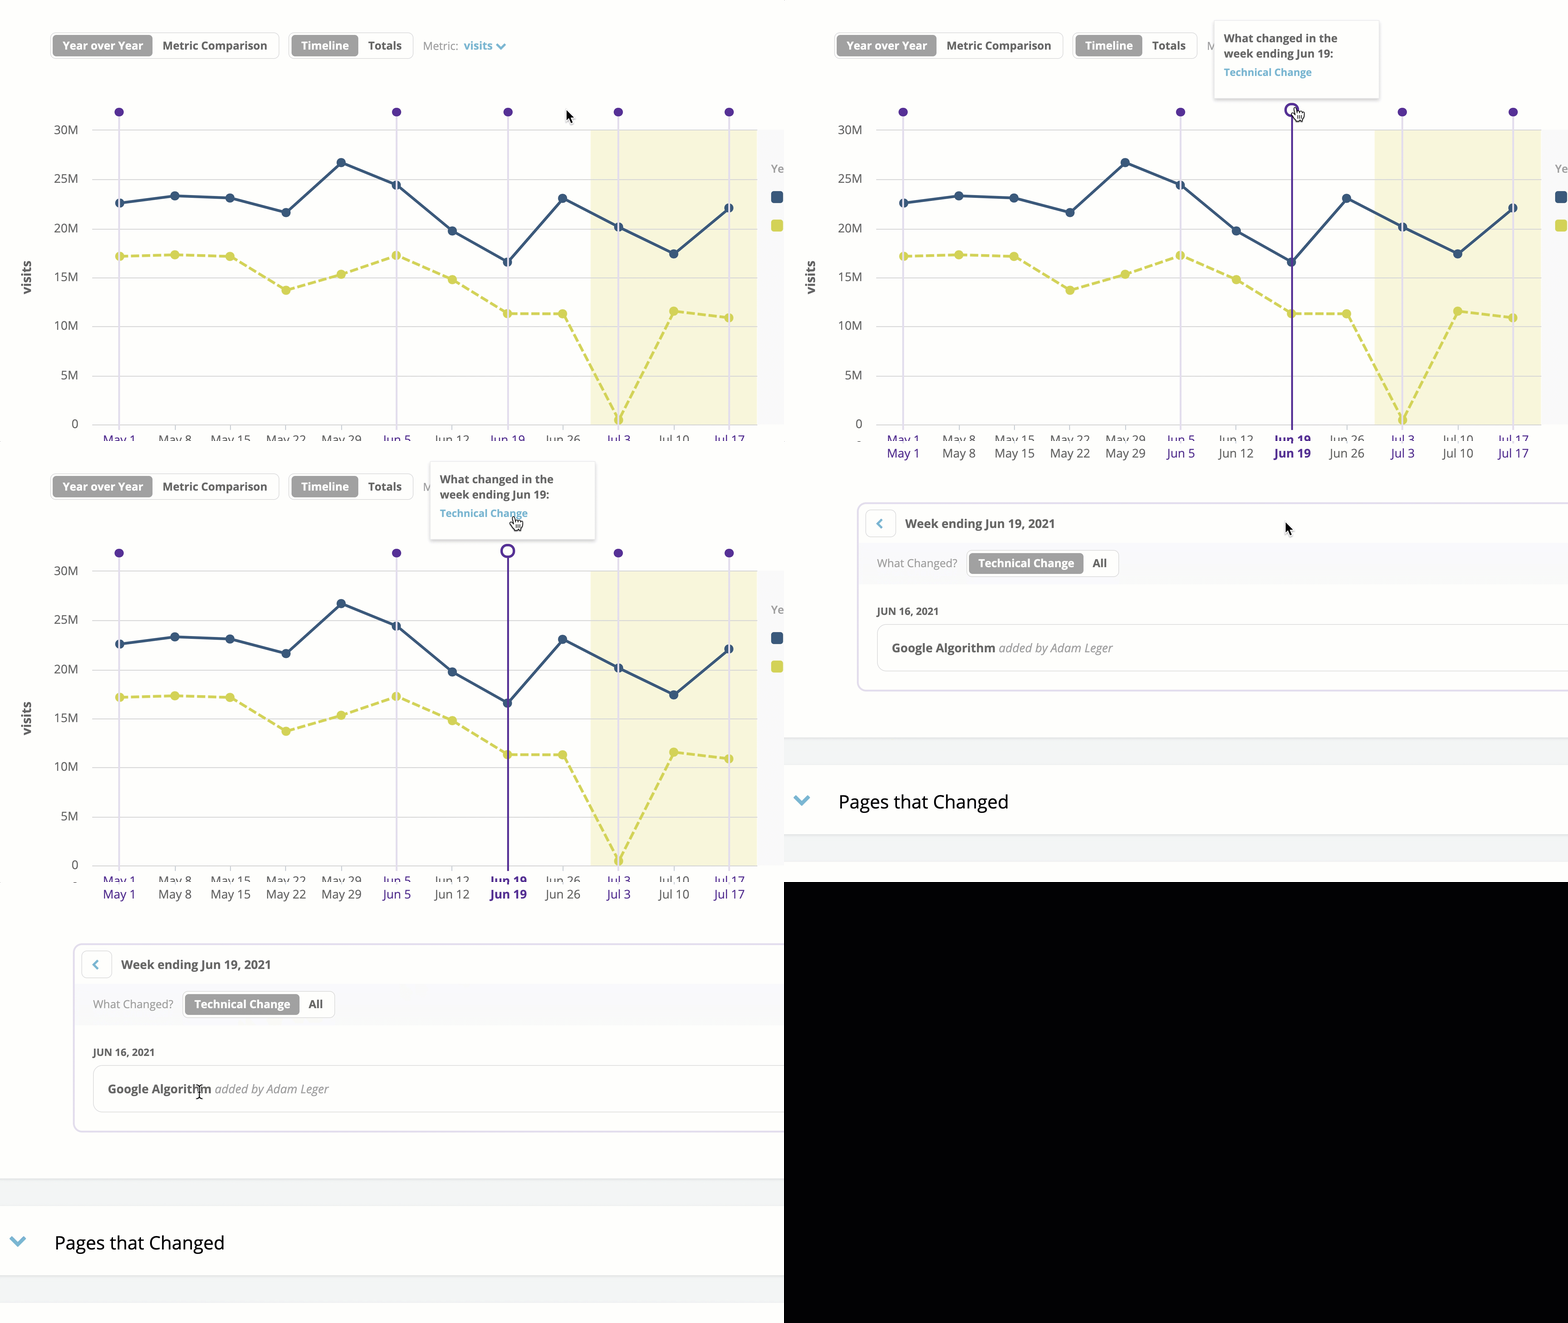
Review a Breakdown of Pages that Changed
Open the Pages that Changed widget to see a high-level overview of the pages that started getting organic traffic or that had detected changes.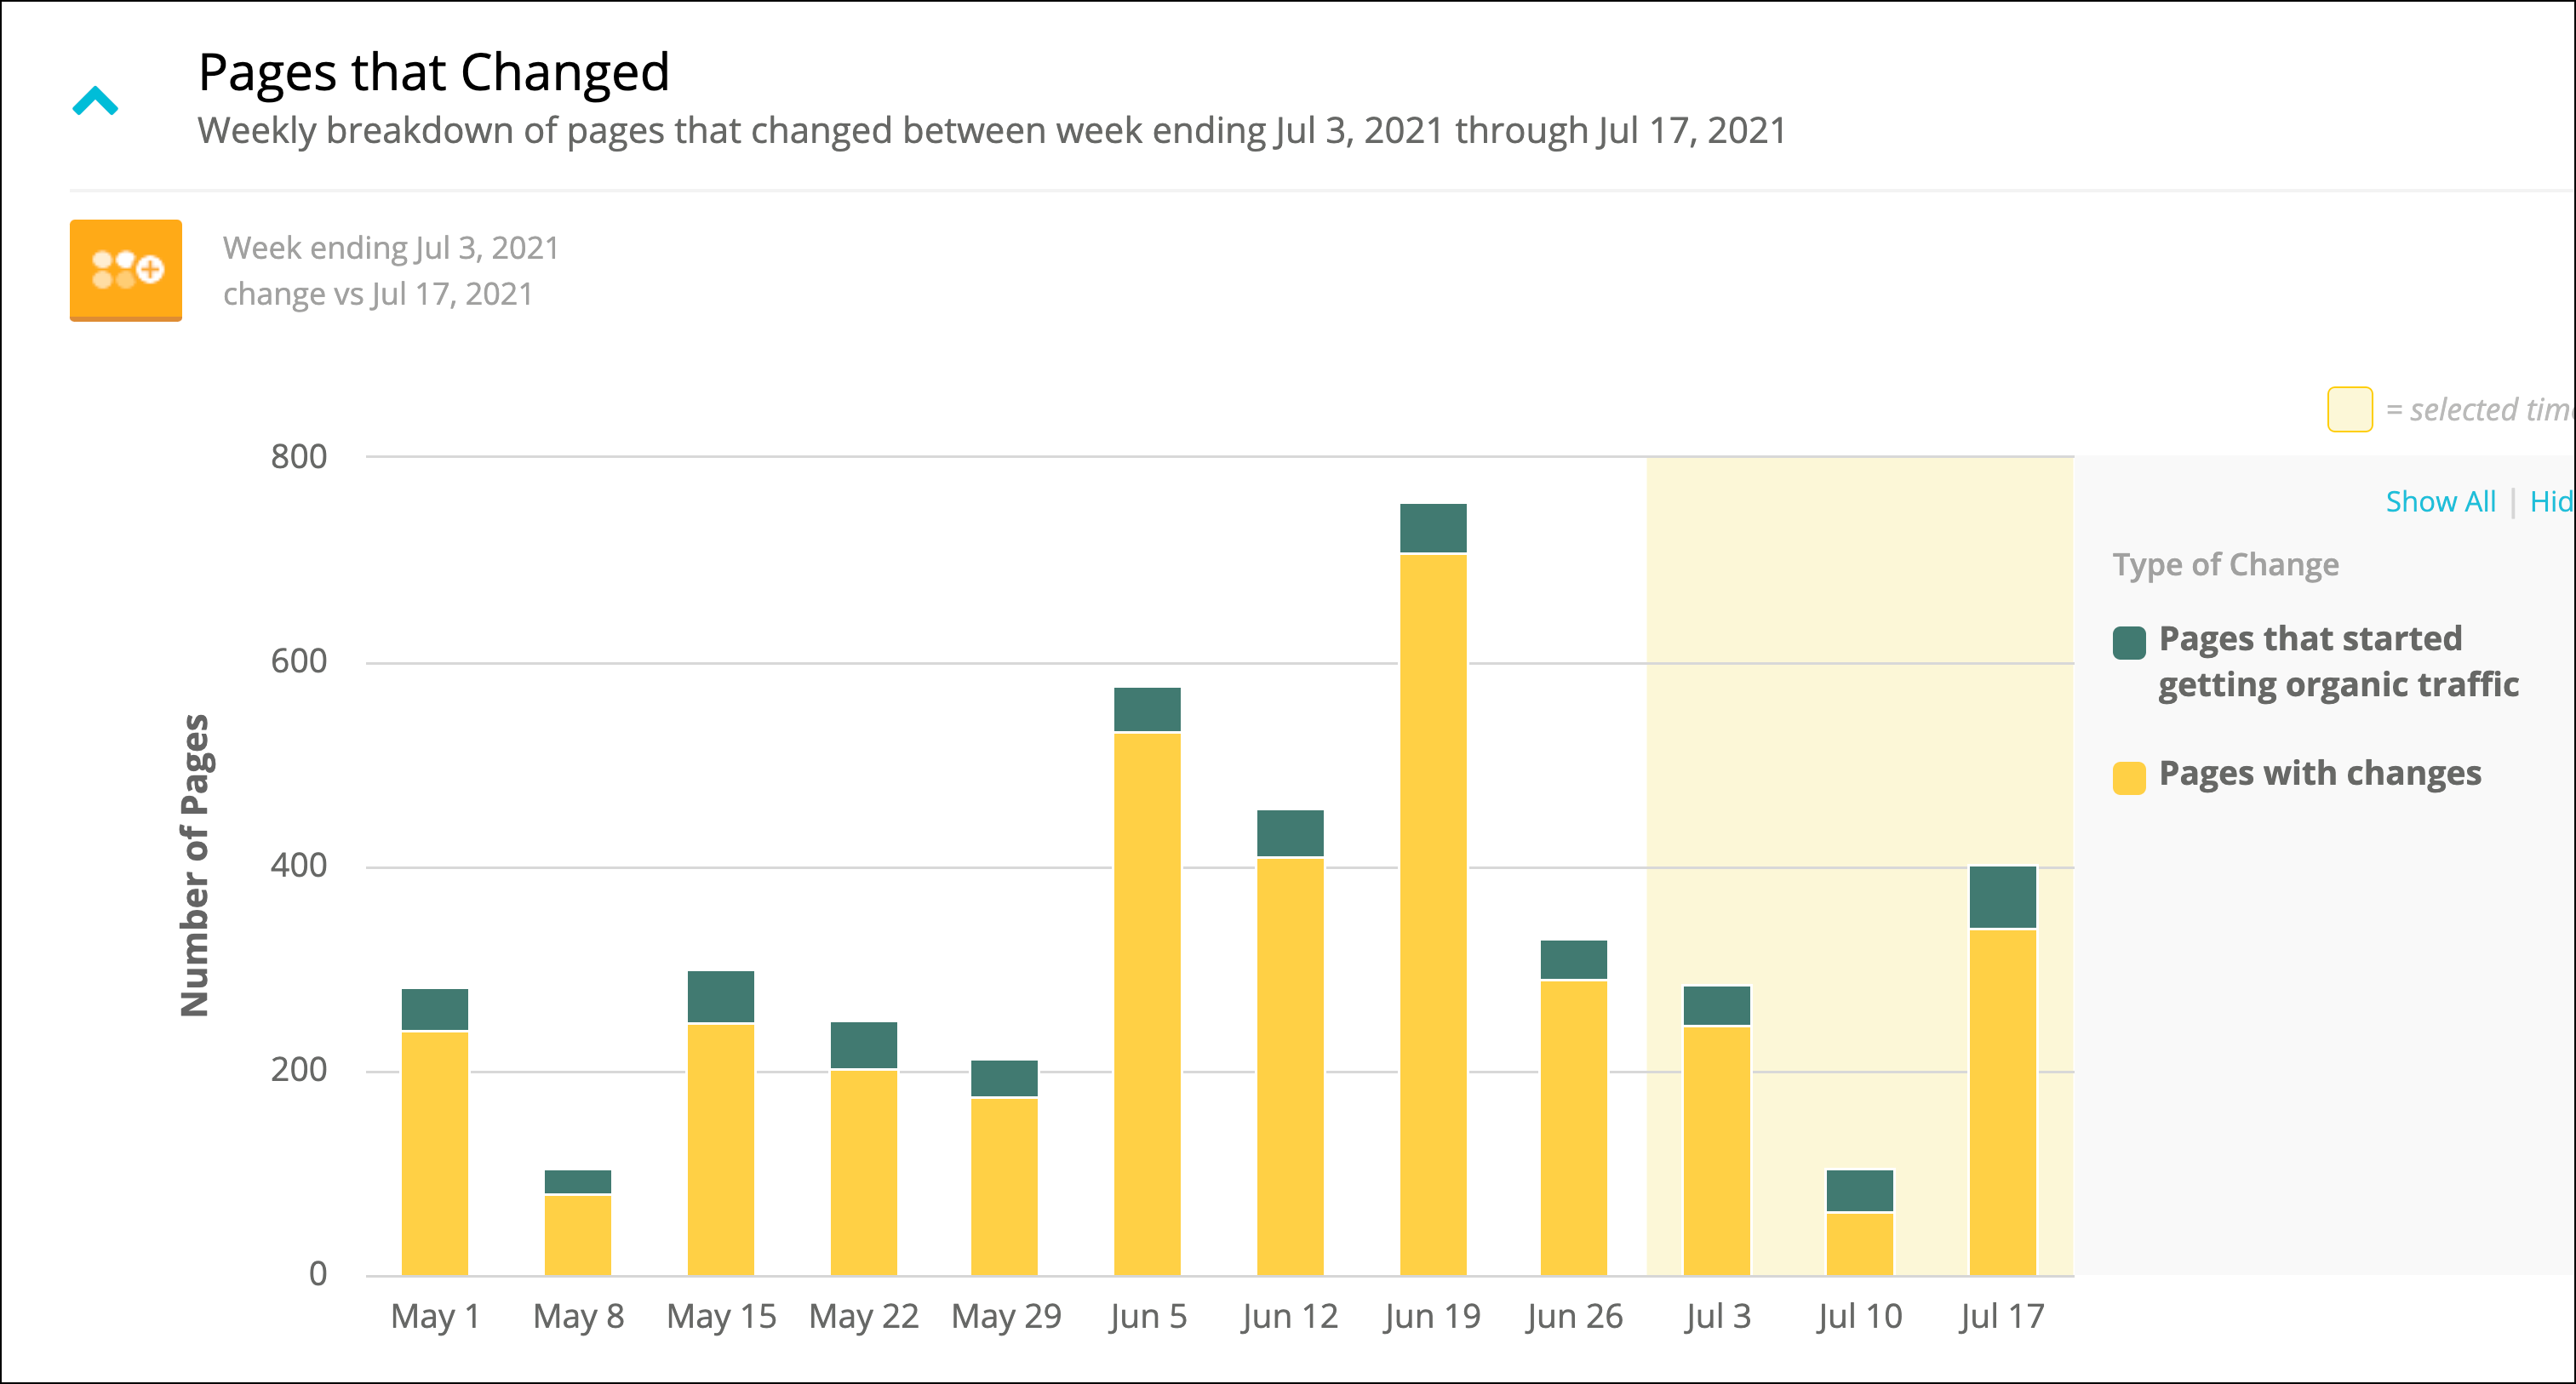
- Title tags
- Meta Descriptions
- h1-h6 tags
Investigate Page Performance
Review the Performance by Page Table
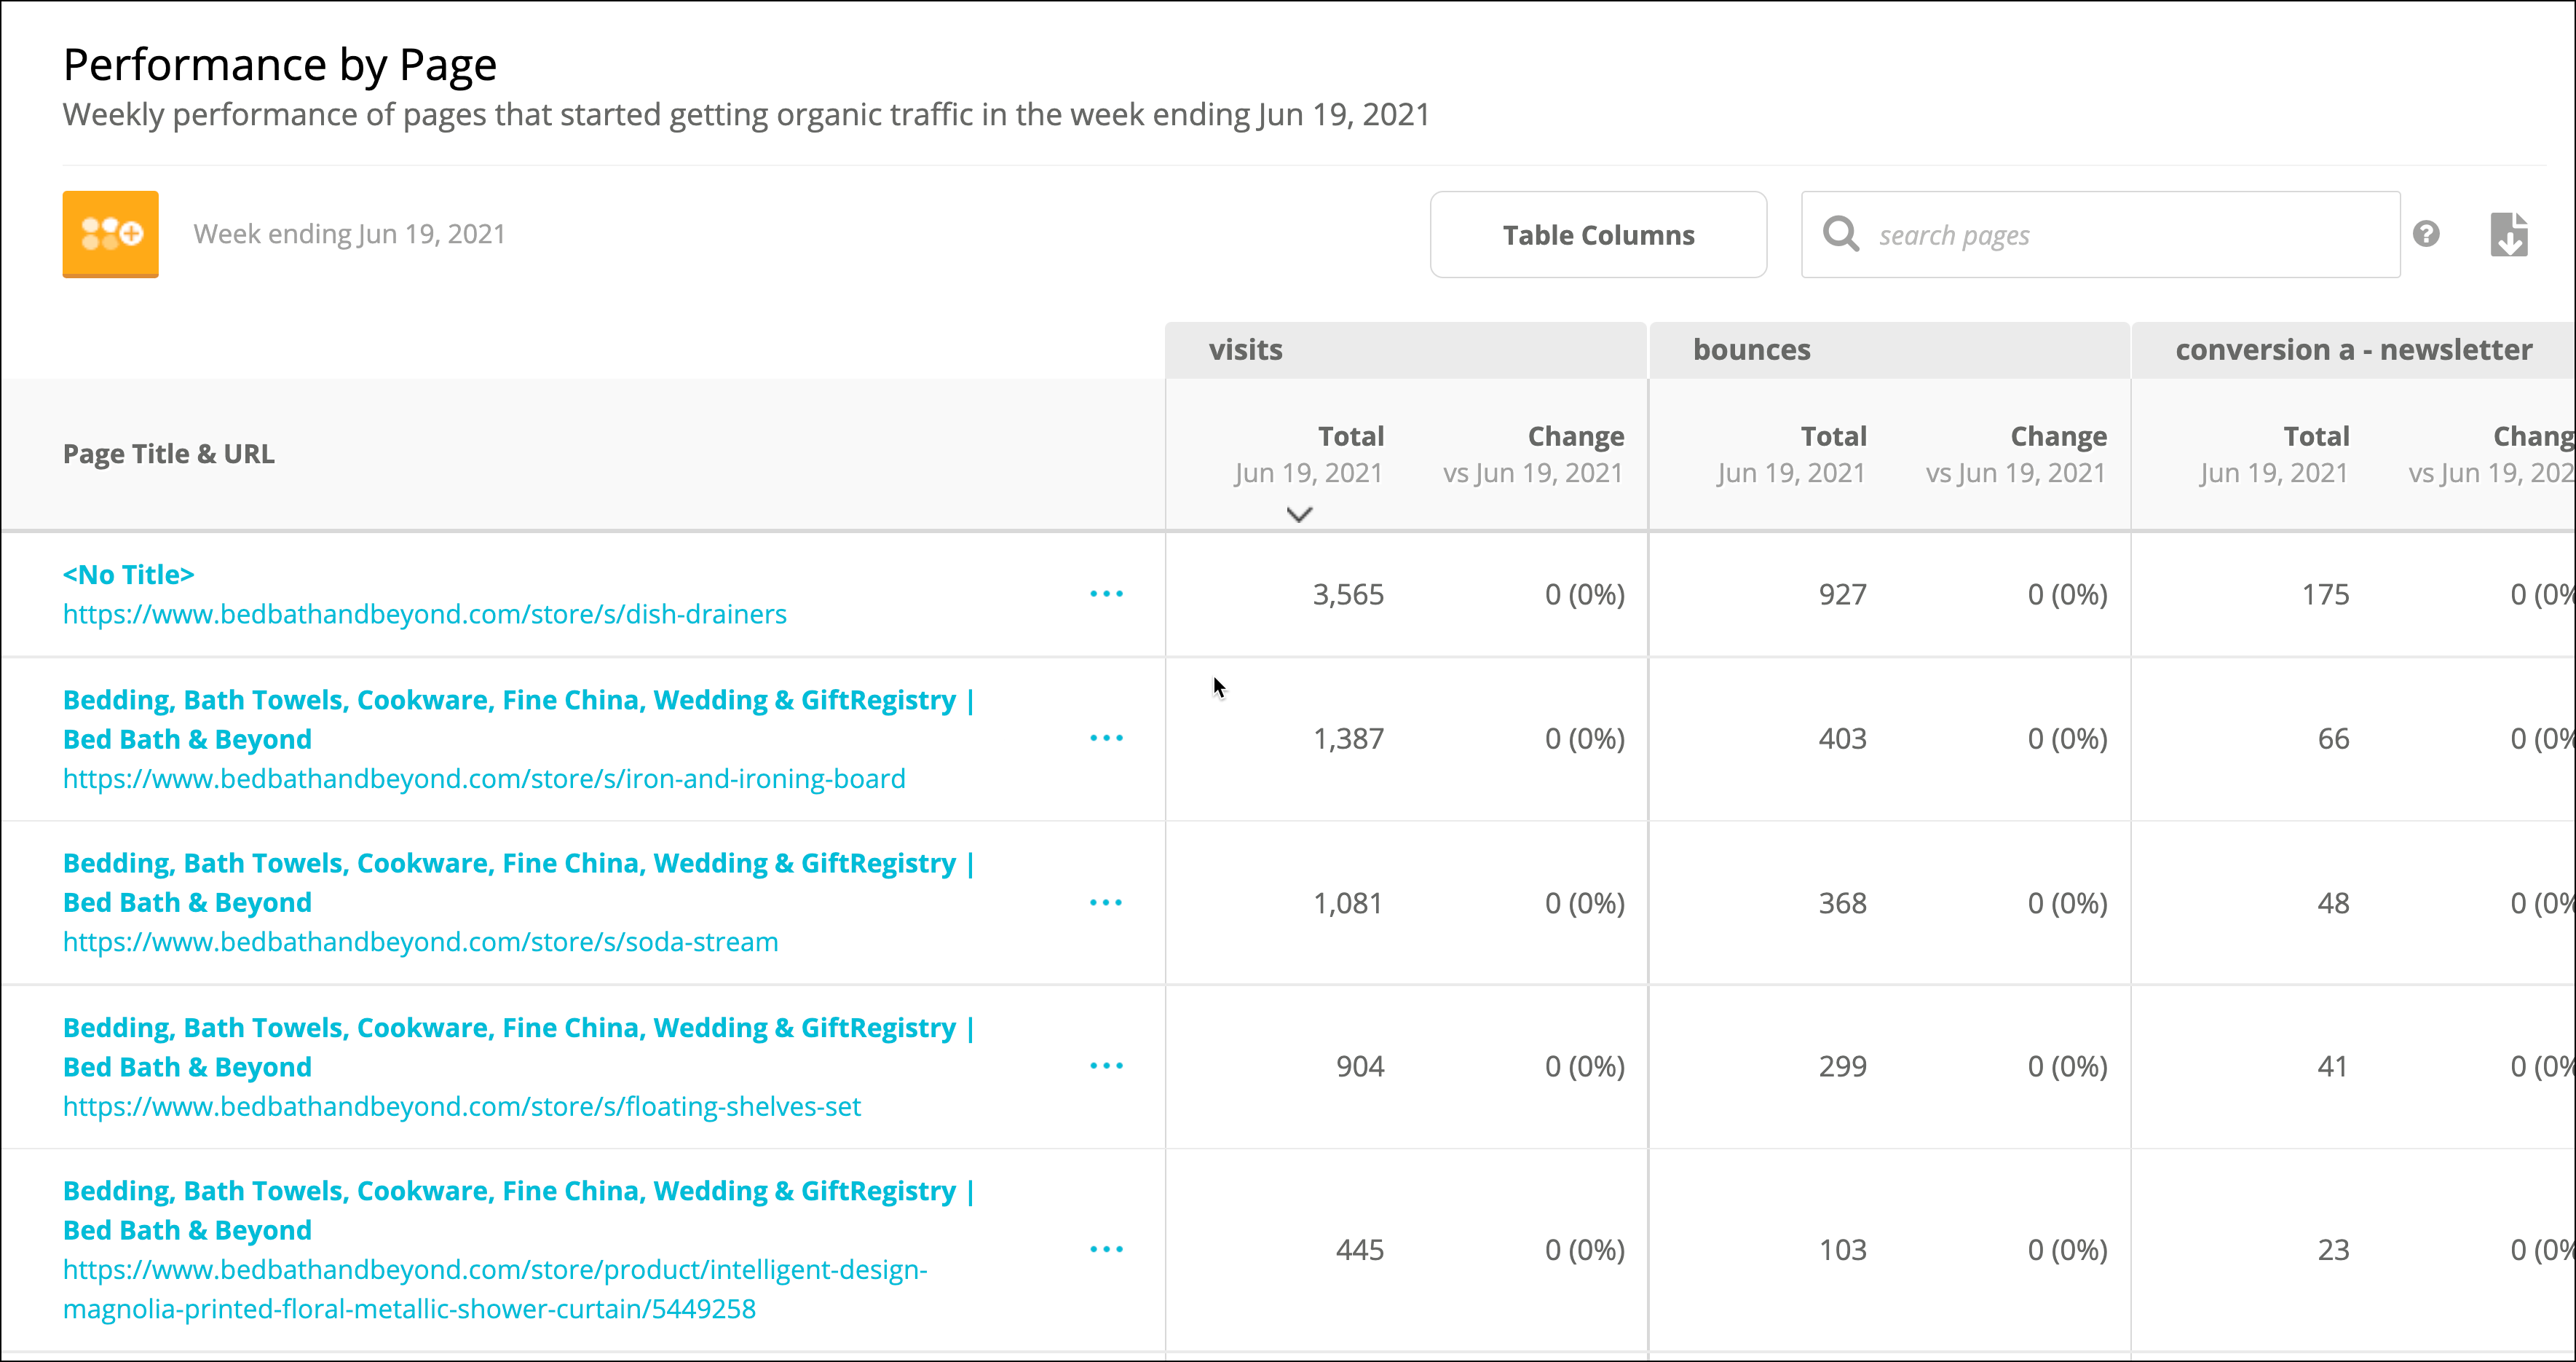
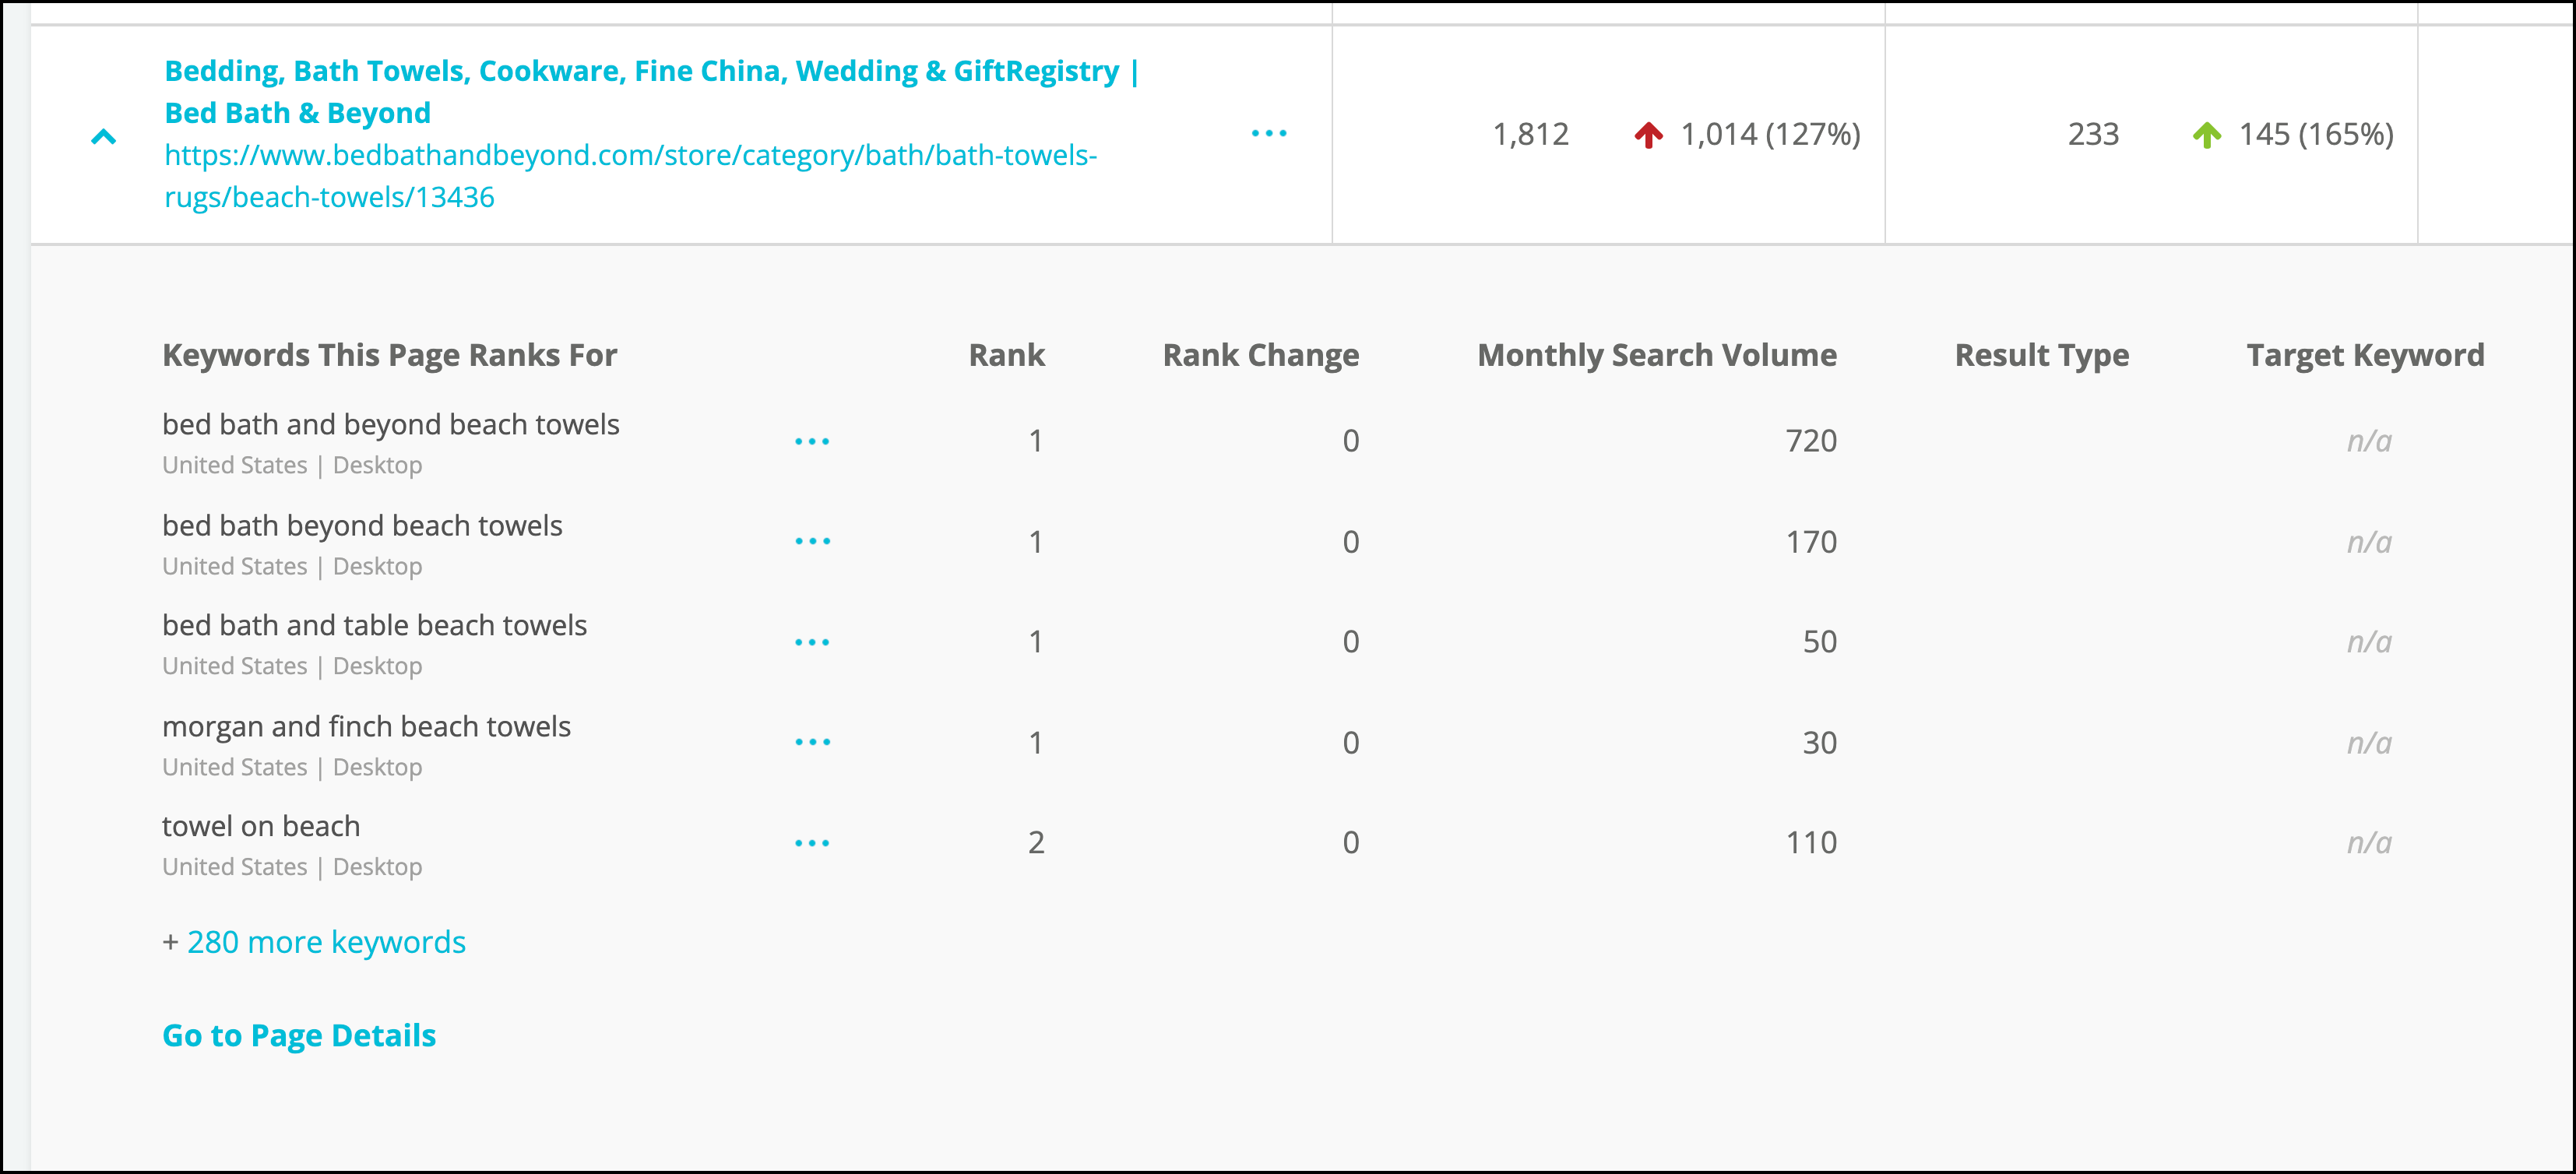
The Performance by Page table includes details and metrics for each of the pages on your site (or in the page group you chose to filter the table that way) that received organic traffic during your reporting time period. Metrics for each page include:- Relevant metrics from your web analytics integration with Conductor.
- The following Google Search Console metrics, if you have integrated your Search Console account with Conductor:
- Impressions
- Clicks
- Clickthrough Rate (CTR)
- Average Position
- Google publishes data from Google Search Console with a several day lag. This means that weekly data publications in Pages will not immediately include the entire previous week’s worth of data. However, each day data from Google Search Console is added to the totals shown in Pages. You should see your full metrics from the previous week no later than Thursday morning.
- For the pages reported on in the Pages report (your top 10,000 by organic traffic), we pull data from the top 50,000 pages by highest impressions from Google Search Console. In the event a page appears in your integrated analytics data and not in your Google Search Console data, Conductor will show “n/a” for the Google Search Console metrics for the page.
- Rank
- Rank Change
- Monthly Search Volume
- Result Type, if non-standard
Page Groups
July 2026: You can review and compare performance by page group in a widgent on the Overview tab in the new Pages report.
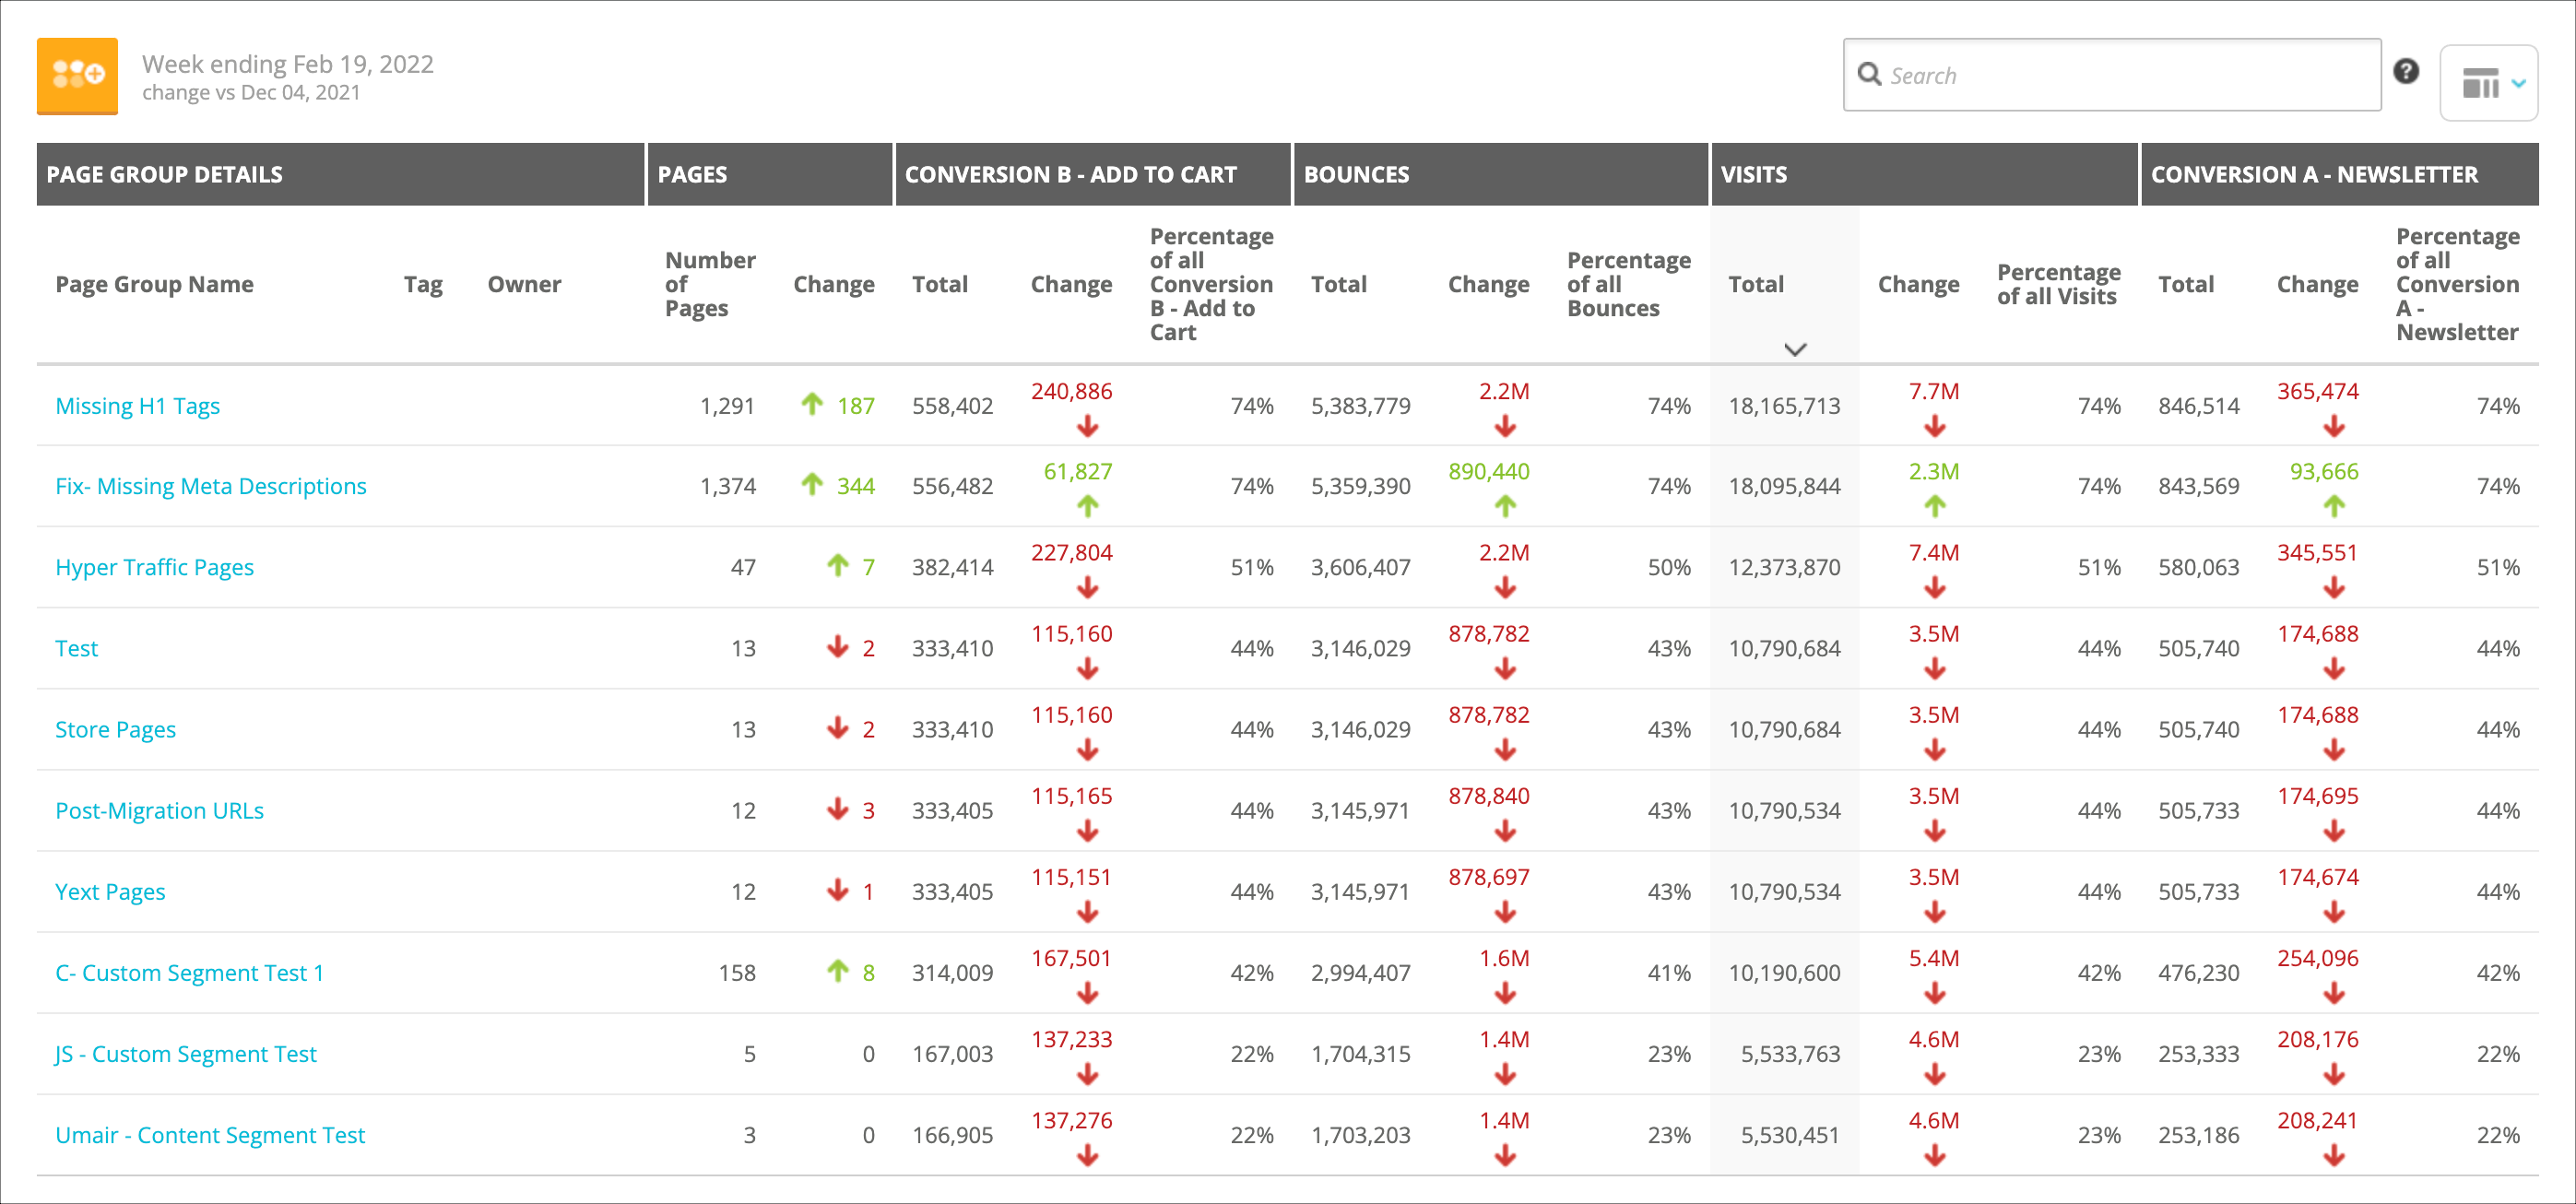
The Page Groups report lets you view the performance of a page group—or compare the performance of multiple page groups to one another.
If you’ve integrated analytics, Conductor data reflects only your top 10,000 pages (or 100,000 pages, if you have upgraded) with organic traffic each week. Remember, all data in this report reflects only organic traffic.
Overview
Determine the Scope of the Report
If you have multiple analytics integrations configured for the web property you chose above, select the integration you want to see data from.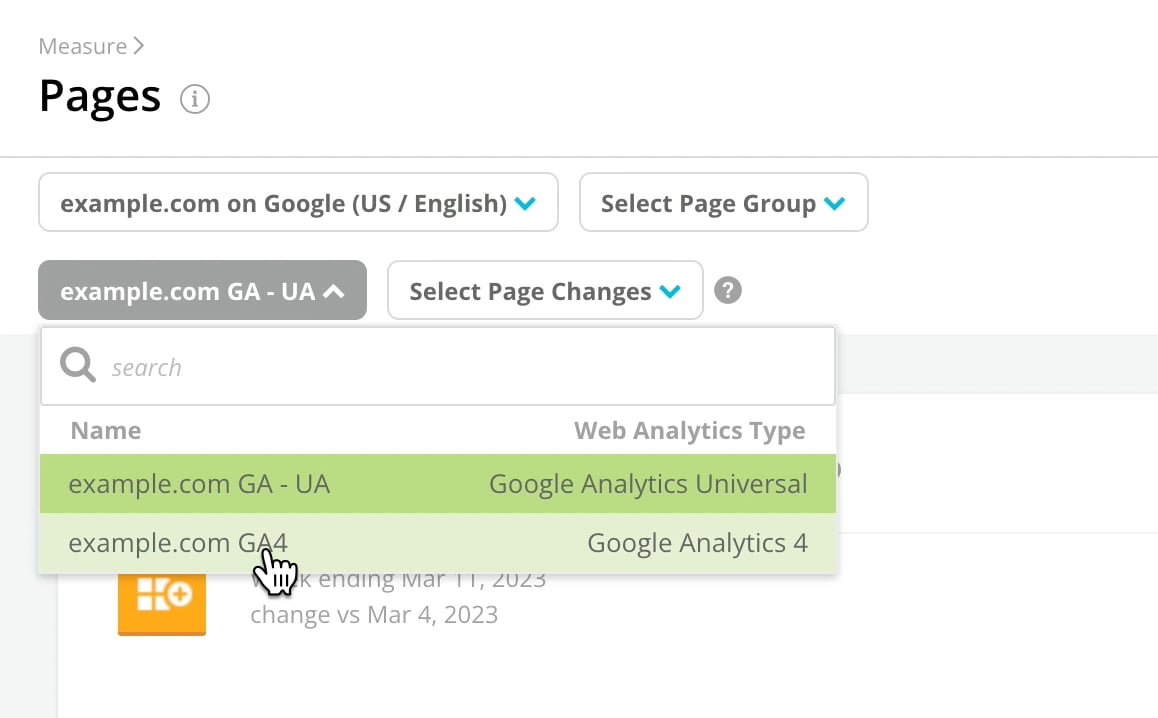
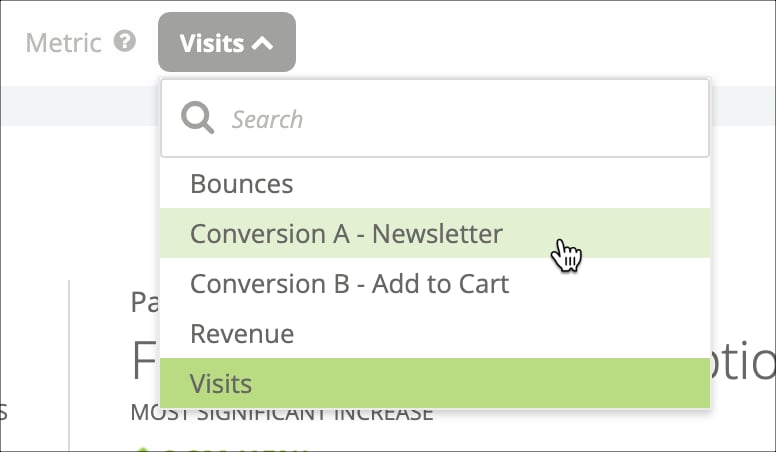
Review the Report
The summary bar includes:- A high-level summary for the selected metric for the selected time period.
- A site-wide perspective of how much the selected data contributes to the overall organic performance of the site.
- The page groups with the most significant increase and decrease, including the percentage change in the values.

Using Page Groups
- Uncover opportunity by identifying underperforming content
- Create a workspace to track your content’s performance
- Building an executive report
- Target optimizations to your buyer personas at each stage of their buyer’s journey
Page Details
Page Details provides details about your site’s performance at the page-level. In addition to tracking the organic performance of individual pages, Page Details relays pages’ keyword visibility, Google Search Console data (where integrated), and identifies new keyword opportunities.
Remember, all web analytics data in this report reflects only organic traffic to the page in question.
You can access the Page Details report throughout Conductor when you click a URL associated with your domain.
Determine the Scope of the Report
Determine the Source for Analytics Data in the Report
If you have multiple analytics integrations configured for the web property this page belongs to, select the integration you want to see data fromDetermine the Reporting Time Period
Select the time periods you want to report on and the granularity (weekly or monthly data):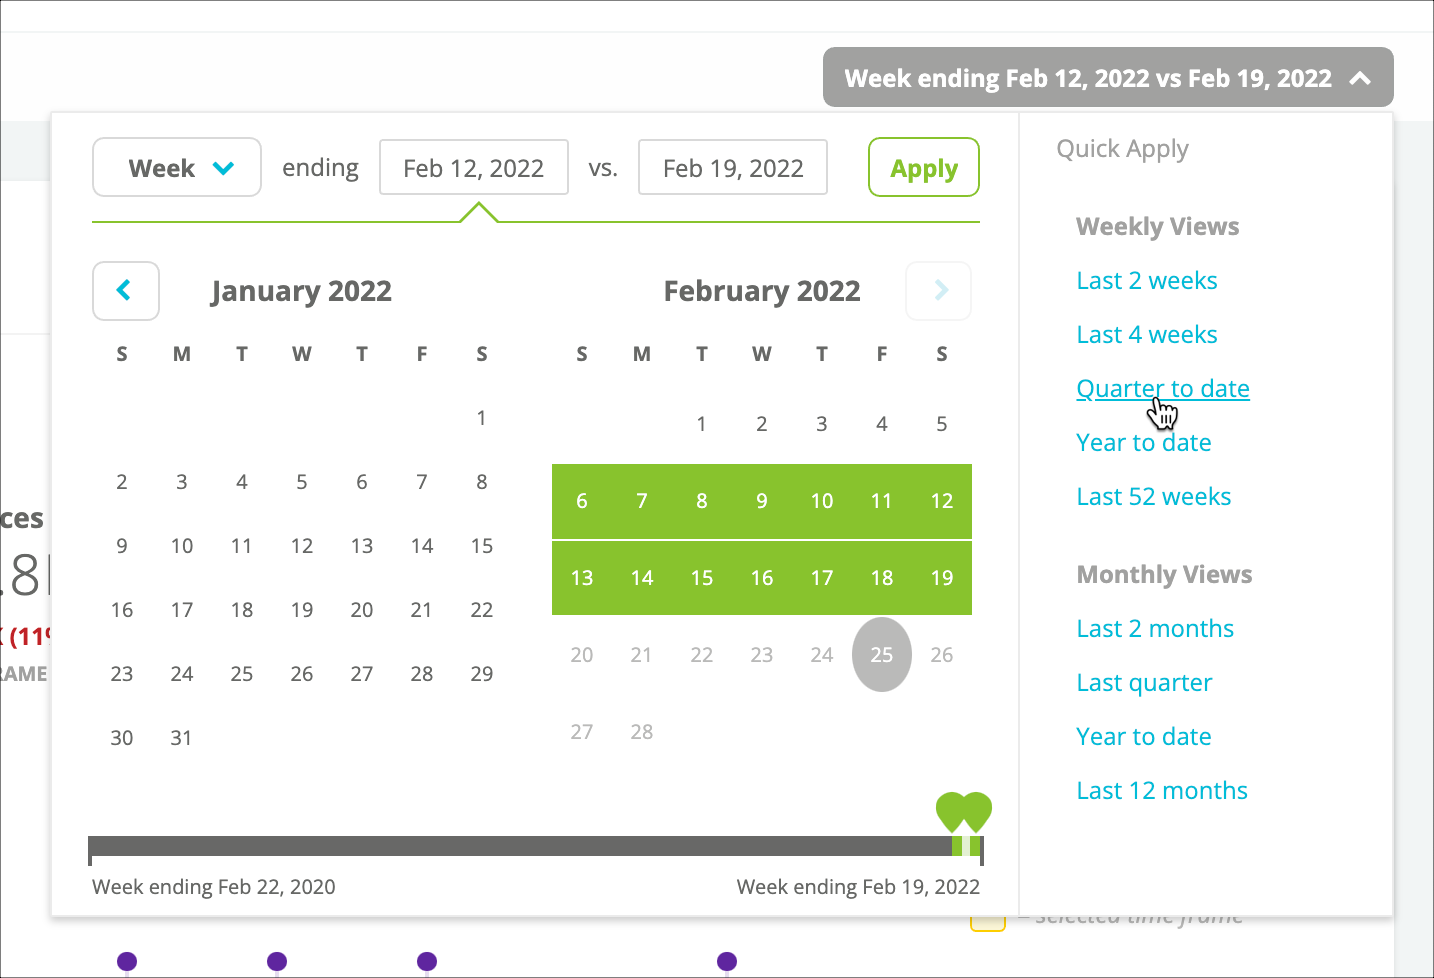
Review This Page’s Organic Performance Data
In the widget at the top, review this page’s organic performance. Note that this widget appears only if you have integrated your organization’s web analytics:- Across the top of this widget, review the page’s performance across the metrics integrated from your web analytics provider.
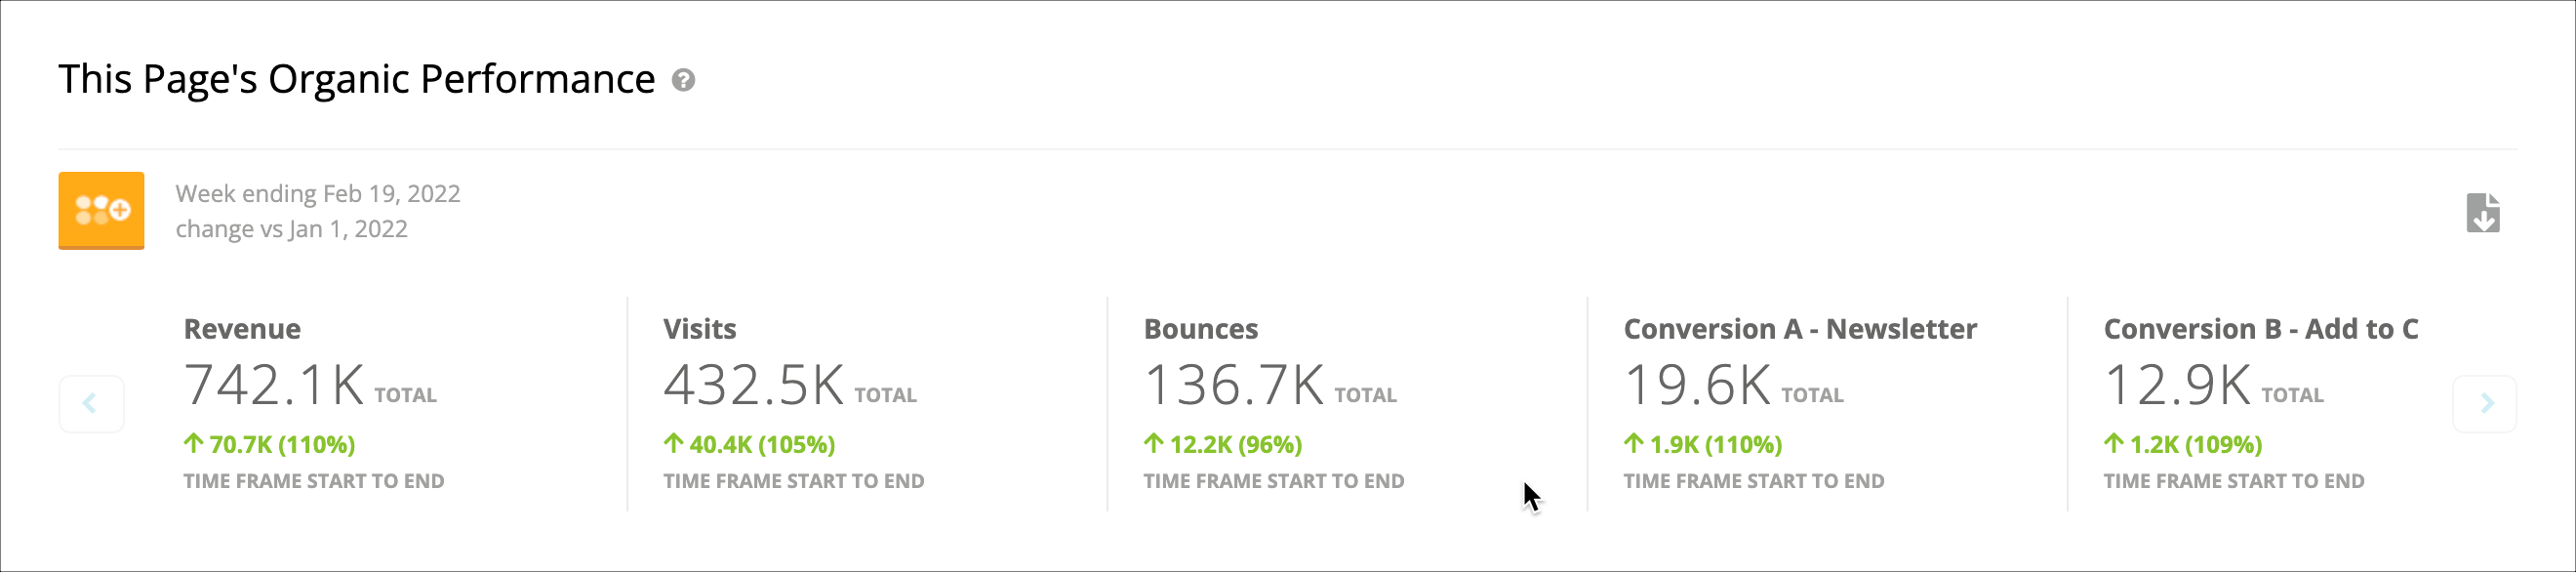
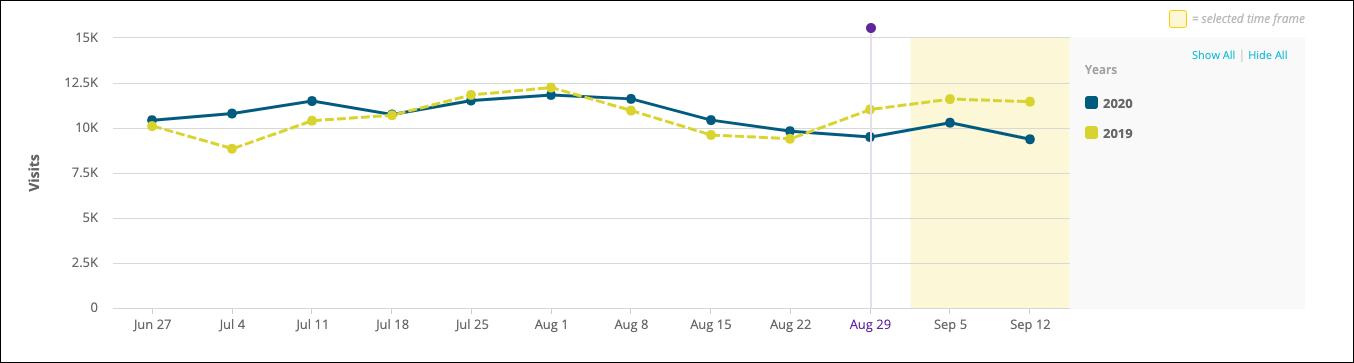
- In the chart below, you can see how this page has performed over time. You can use the following selector to choose to review data from the views listed below:

- Year over Year
Select the metric you want to review data for:Then see how your performance for a specific metric compares to previous years’ performance.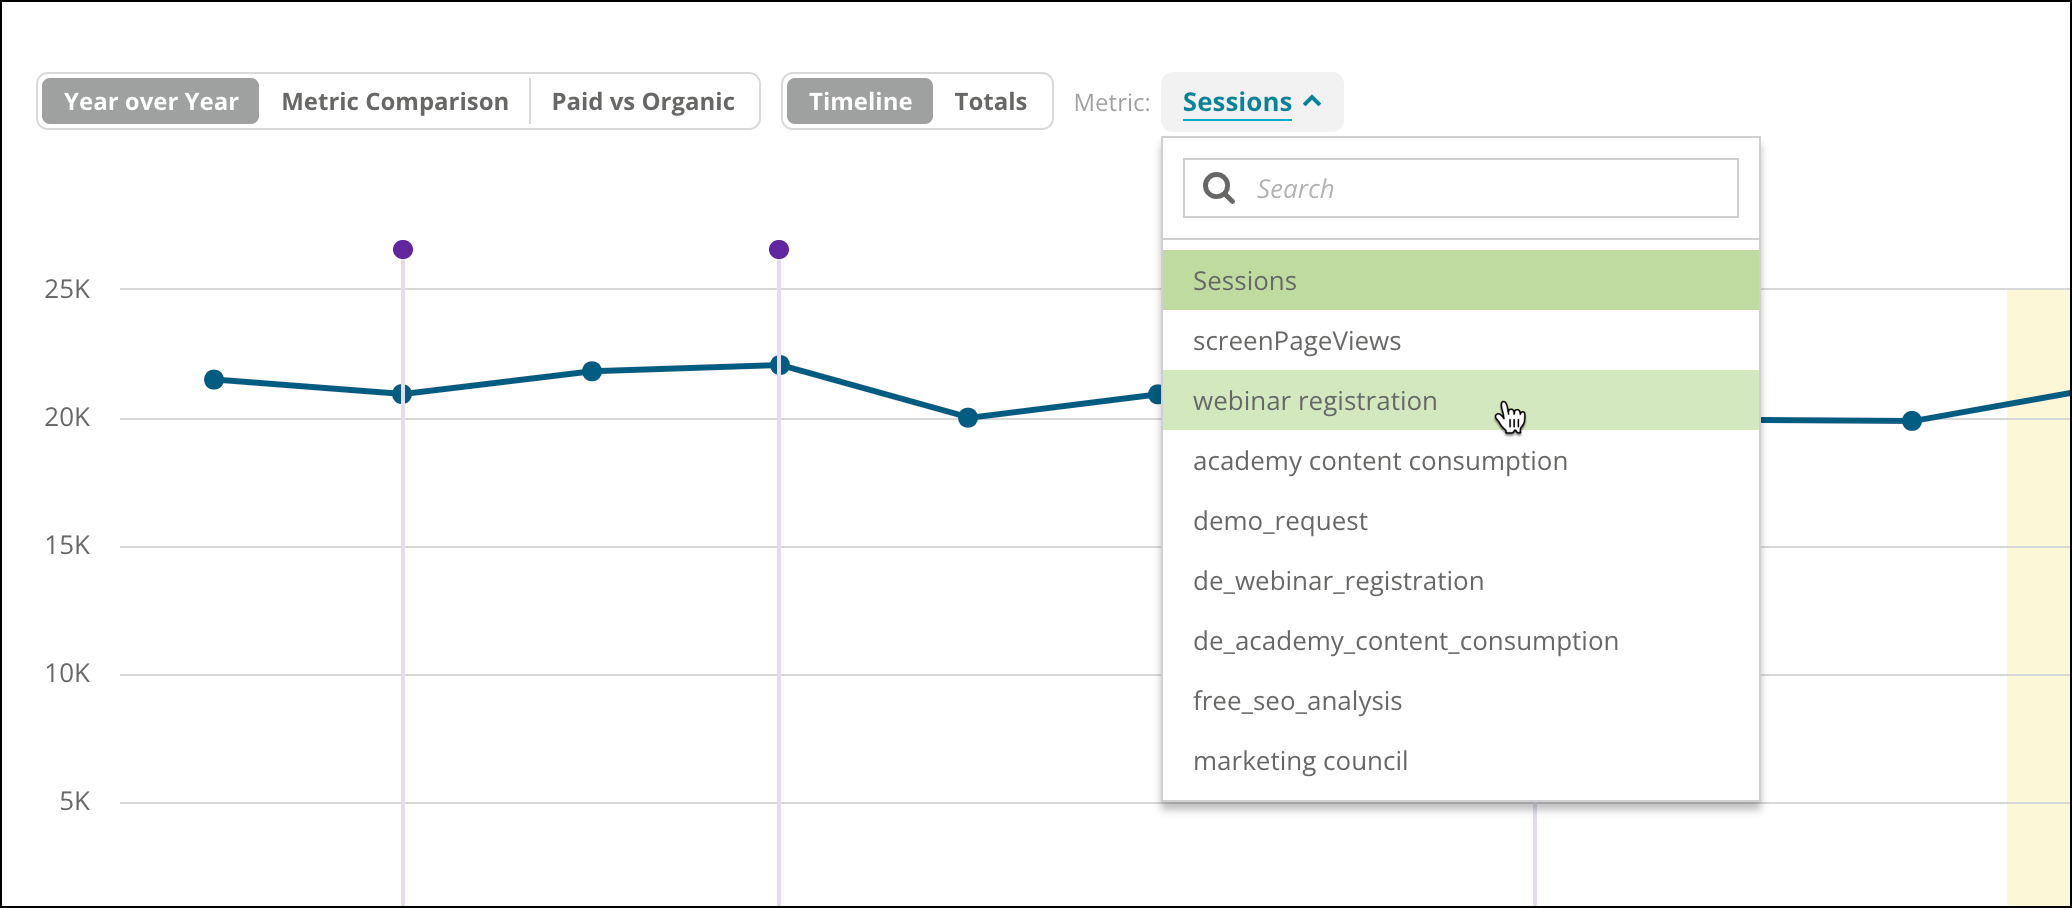
- Metric Comparison
Select the metrics you want to compare:Then quickly see how your integrated metrics stack up.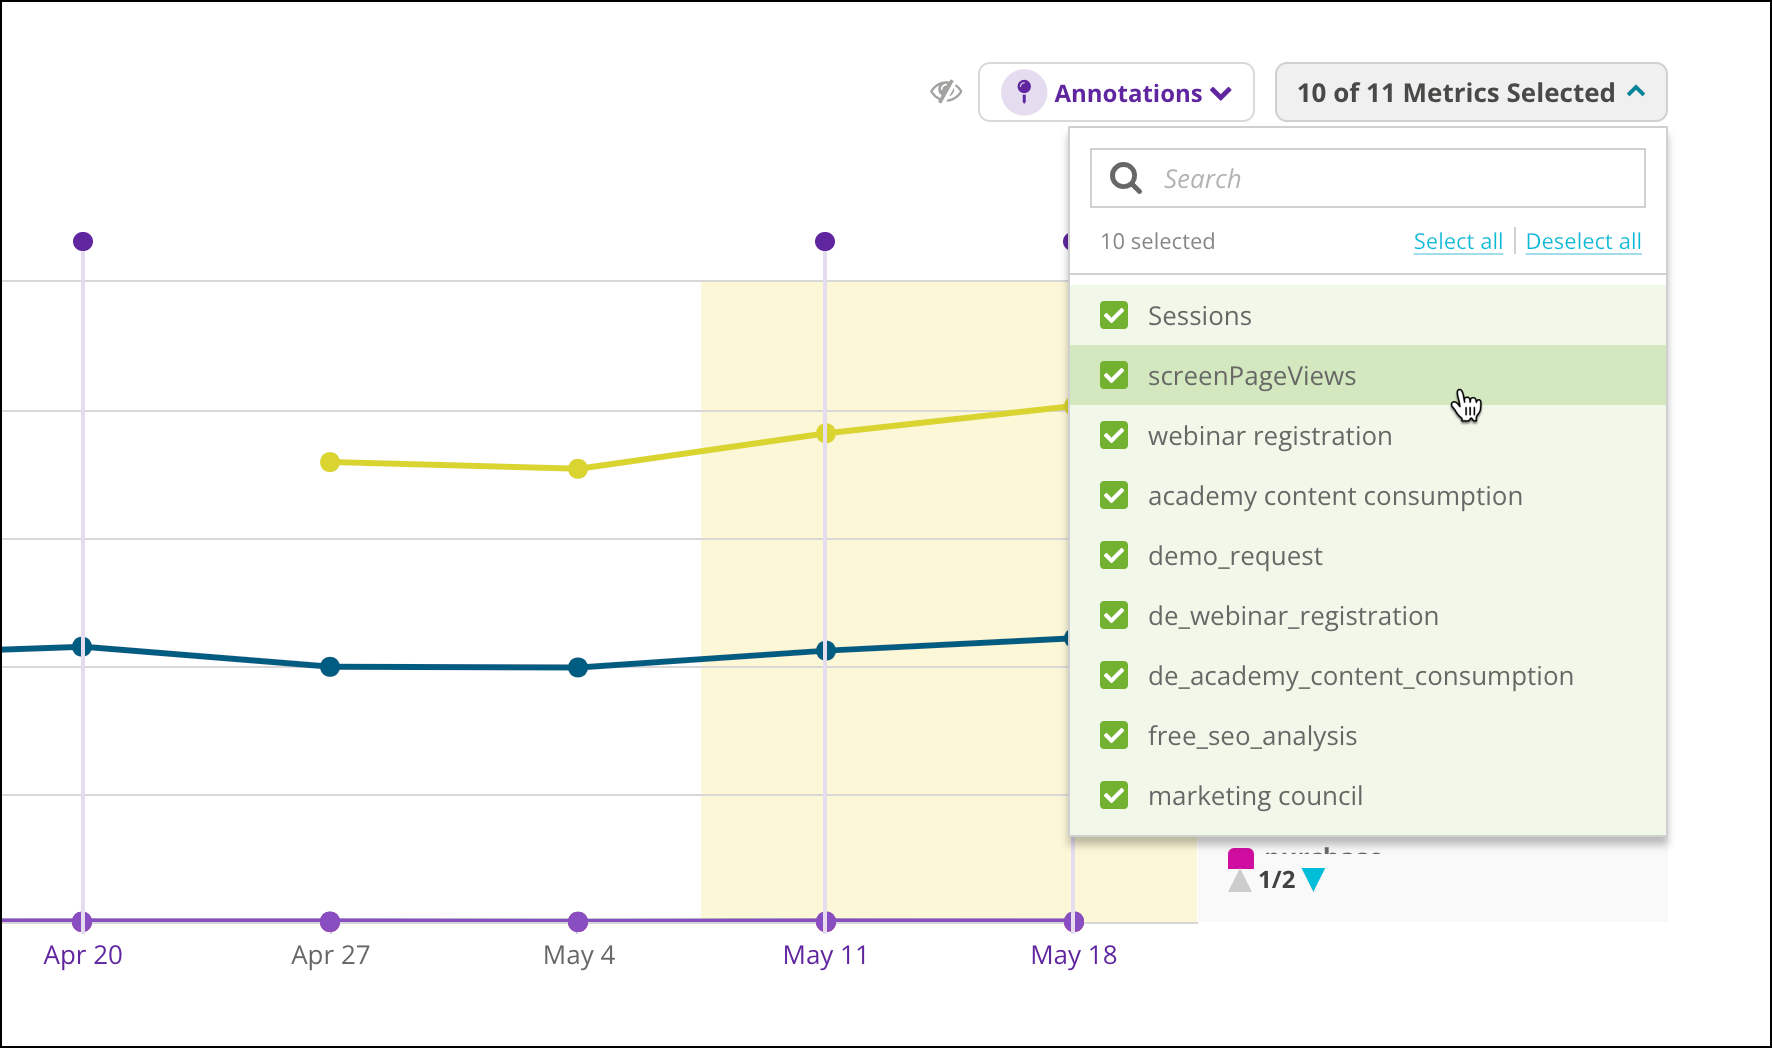
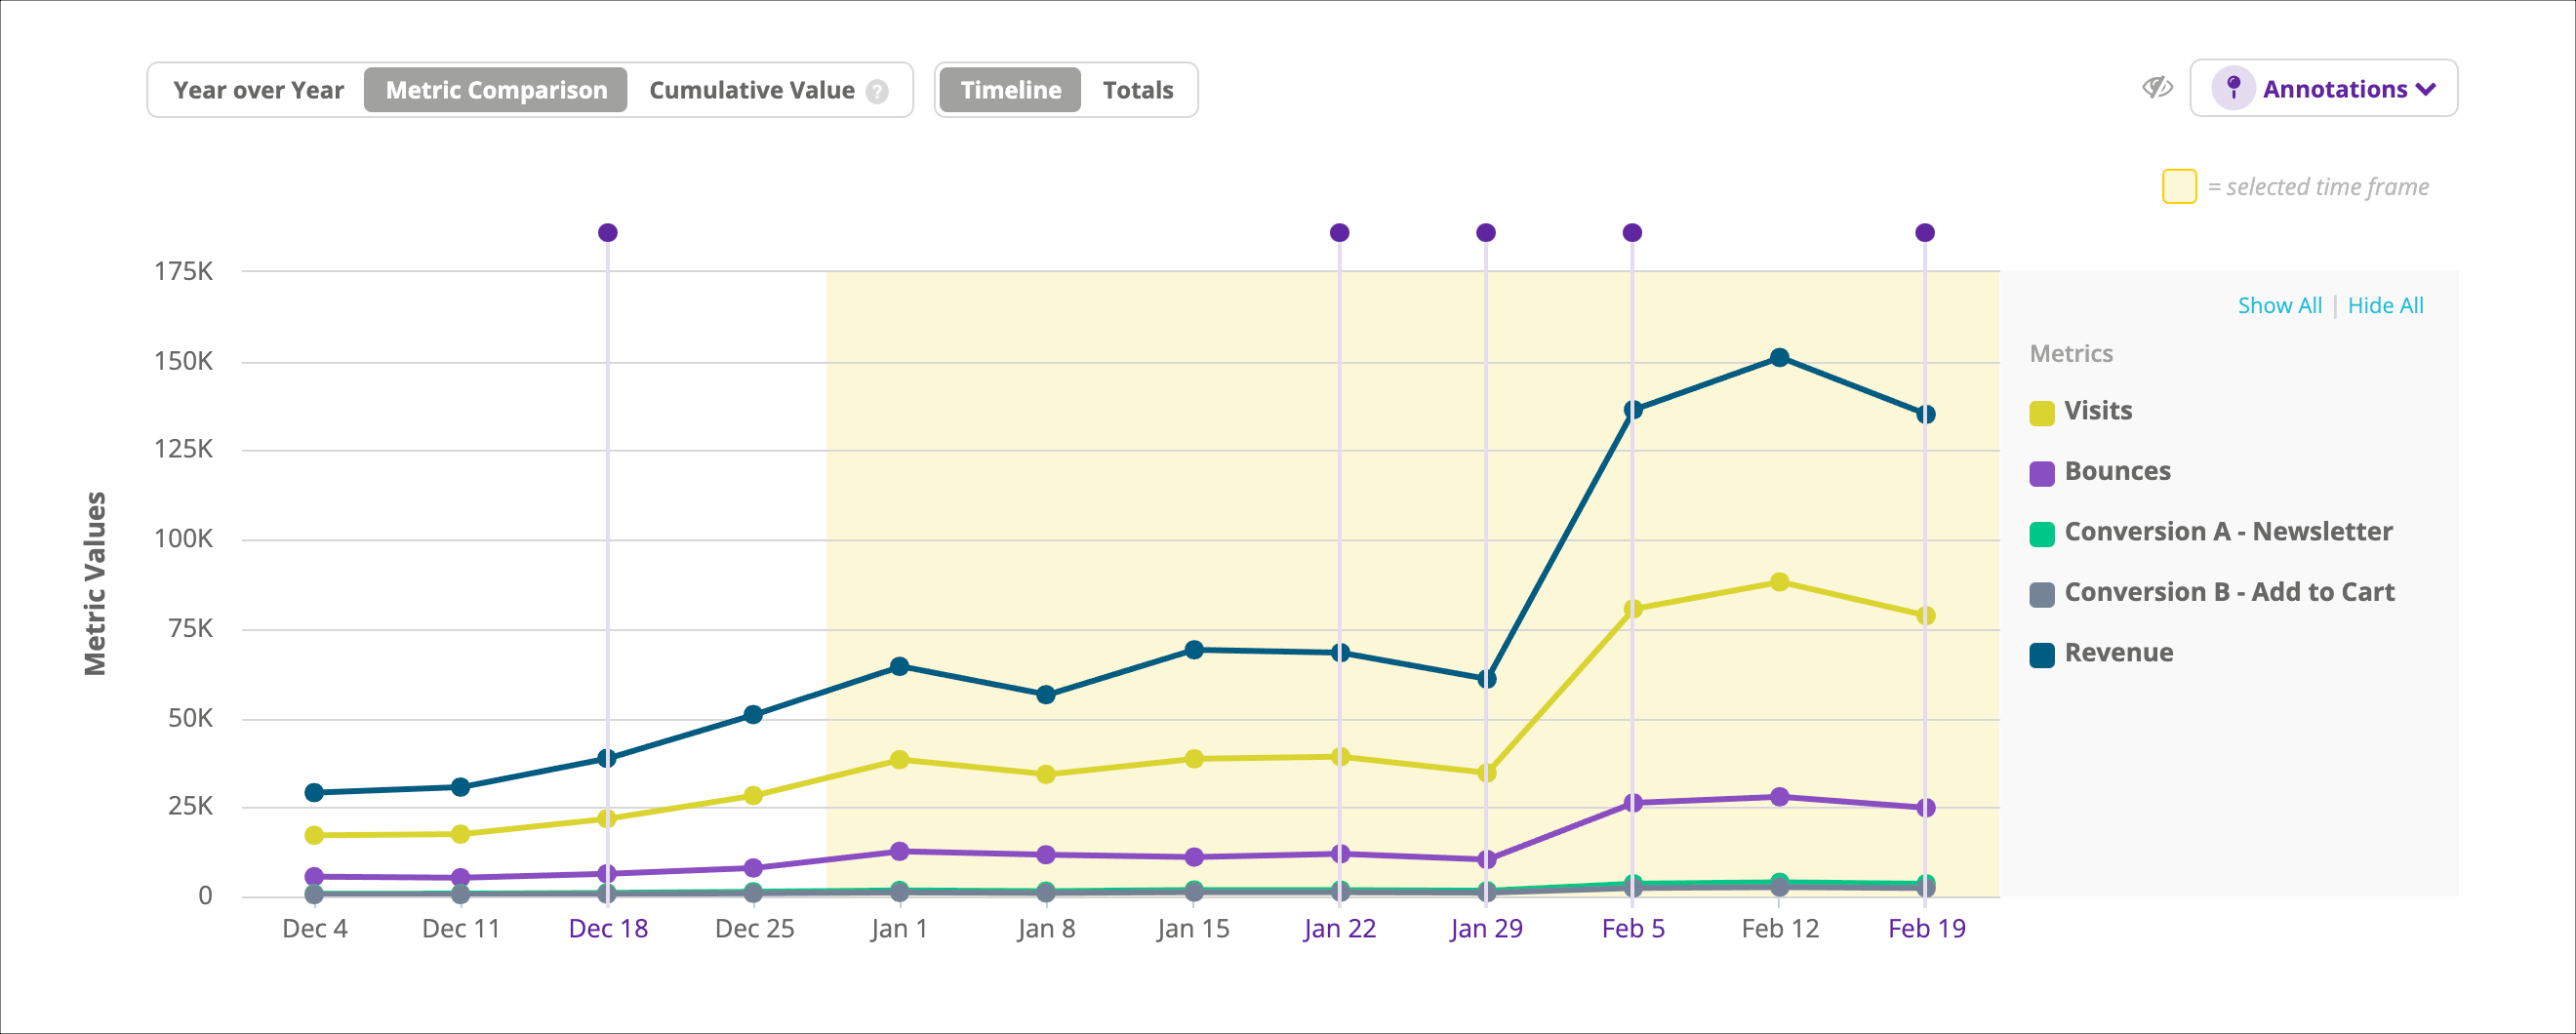
- Cumulative Value
Note that this option is a legacy feature. Newer accounts no longer have access to it.
See how your page’s performance for a metric adds up over time to understand how much value the page has generated for your organization since Conductor first identified it.Note that data in this graph reflects the aggregate value of only the 24 most-recent months. Page Details does not include more than 24 months of historic data.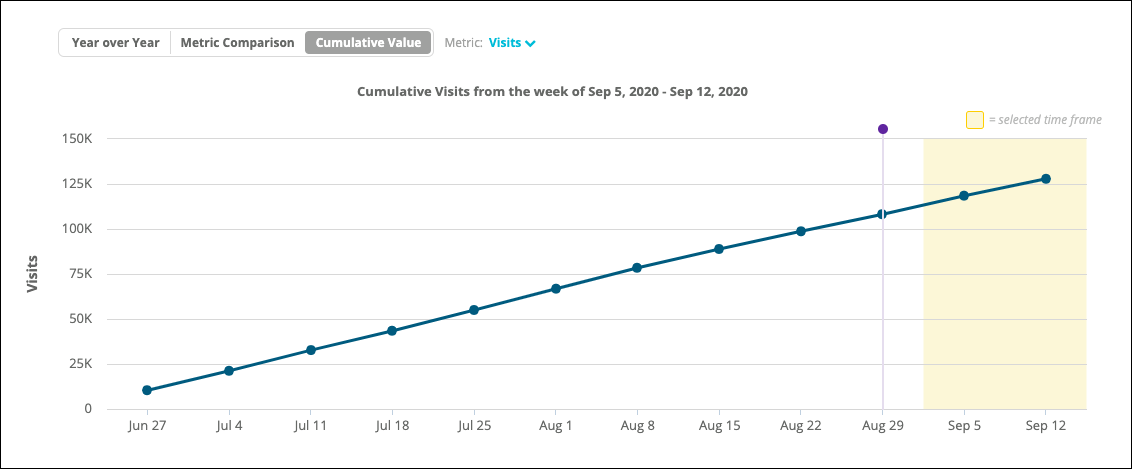
- Year over Year
- For any of the views listed above, you can use the following selector to determine whether you want to see this data over a Timeline or as Totals:

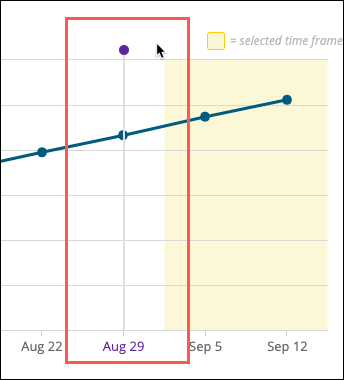
- Review any Annotations. These may be custom annotations or changes detected by Content Activity Reporting. You’ll see changes to Title tags, Meta Descriptions, or h1-h6 tags. These annotations appear as purple pins:
Review the Keywords a Page Ranks For
Learning about the keywords for which your page appears in search engine results pages can help you understand which topics drive organic traffic to the page. Are the keywords you targeted with this page still worth targeting and tracking with Conductor? Are there keywords you don’t currently track with Conductor that might be worthwhile to target with this page’s content? Page Details can help you answer those questions.Determine the Scope of the Keyword Chart and Table
Configure the following controls to determine what data the chart and table in Page Details shows:
Review the Keyword Trend Chart
The This Page’s Rank Over Time chart shows the keywords for which this page ranks with their ranks trended over the time period you are reporting on. As with the performance chart above, you can also review any Annotations.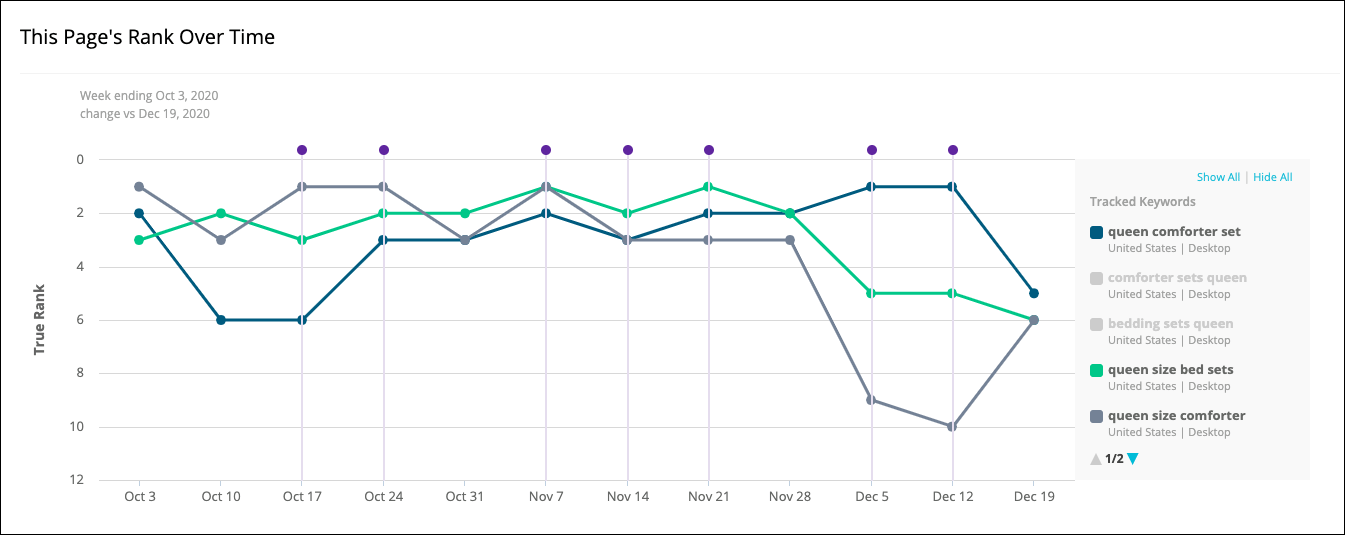
Review Keyword Data for This Page in the Table
- Filter your keywords. Use the filters above the keywords table to surface insights or focus on areas of interest.
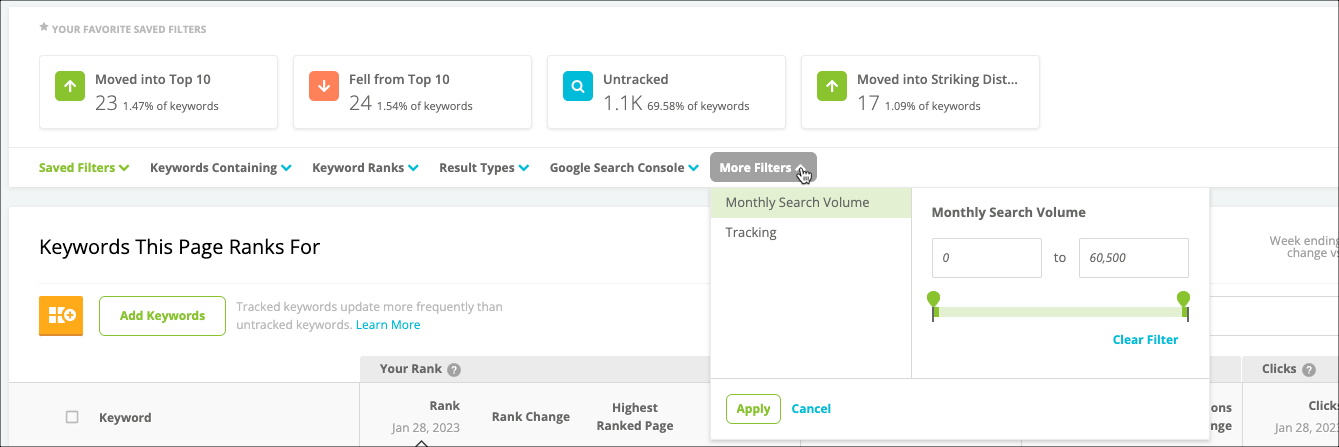
- Choose the Columns to Display. Use the Columns menu to select the columns you want to see. Note that the data that appears depends on whether you are reviewing Tracked or Untracked keywords.
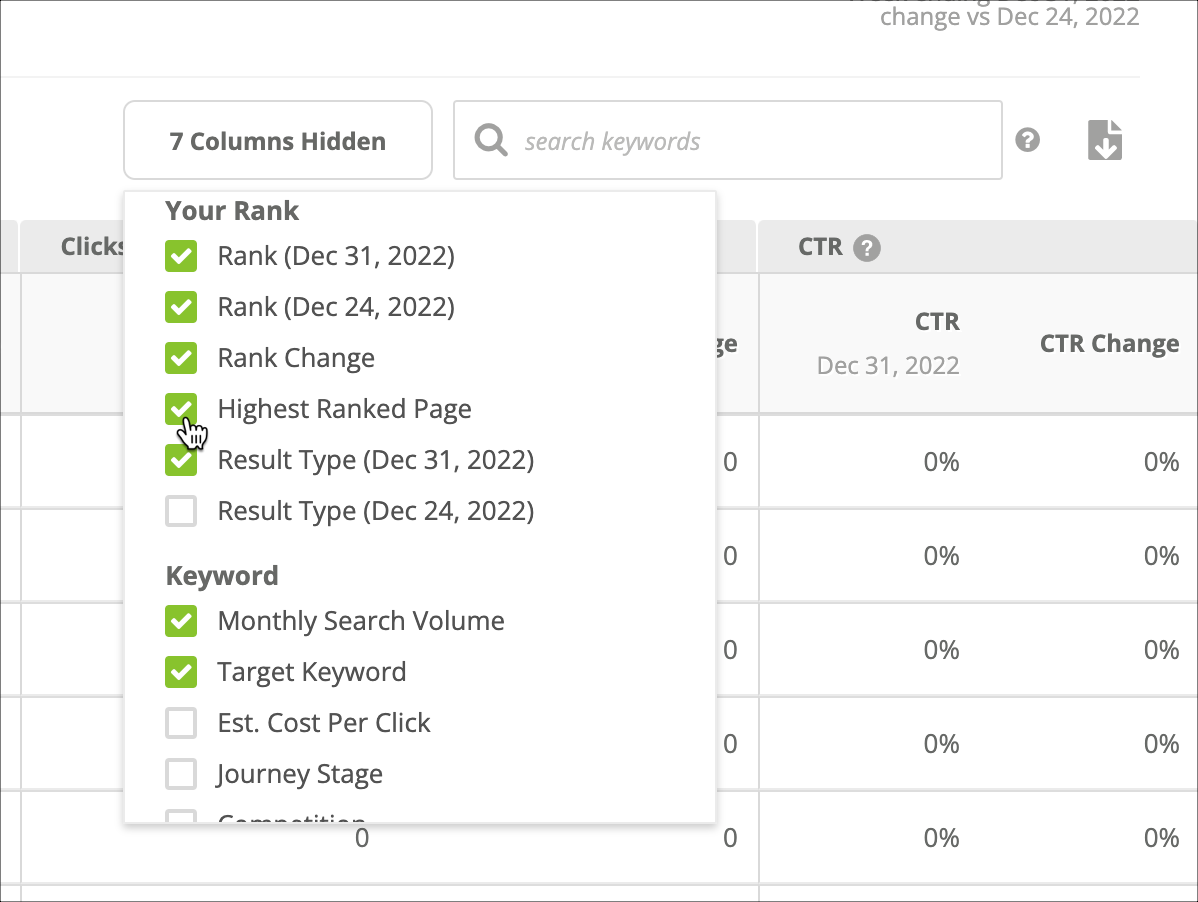
- Keyword
Indicates the keywords that rank for this page. They may be tracked or not tracked with Conductor. Tracked keywords appear as hyperlinks you can use to access the Keyword Details report. - Rank
This page’s rank for the keyword on the selected search engine during the indicated time period. - Rank Change
The difference in rank between the first and second time periods you chose to report on. - Highest Ranked Page
A green check mark indicates that this page is your organization’s highest-ranked for the keyword. - Result Type
The universal result types that appear as results for this page when people search for this keyword during the indicated time period. - Monthly Search Volume
The monthly search volume for this keyword. - Target Keyword
Indicates whether you’ve marked this keyword as a target for this page. - Est. Cost Per Click
The average bid on the keyword in paid strategy. You can use this column to identify keywords to optimize for organic search, so your paid team can save on their spend for that keyword. - Journey Stage
The likely stage in the buyer’s journey associated with the keyword. Refer to this FAQ to learn which words and phrases Conductor uses to determine whether a query is early- or late-stage. - Competition
The relative competition each keyword has based on paid bids.
These metrics reflect how your page performs for the following metrics from your integrated Google Search Console account. This data is also device-specific. You can use the control above the table to filter.
- Impressions
From your Google Search Console integration. The number of times someone saw a link to your site on the Google results for this keyword. - Clicks
From your Google Search Console integration. The number of times someone clicked a link to your site on the Google results for this keyword. - CTR
From your Google Search Console integration. The calculation of the number of Clicks divided by Impressions (see above). This value indicates the frequency with which people click to go to your site when they see a link to it on Google’s results for this keyword. - Position
From your Google Search Console integration. The average position of each of the keyword impression.
Review the Data in the Table
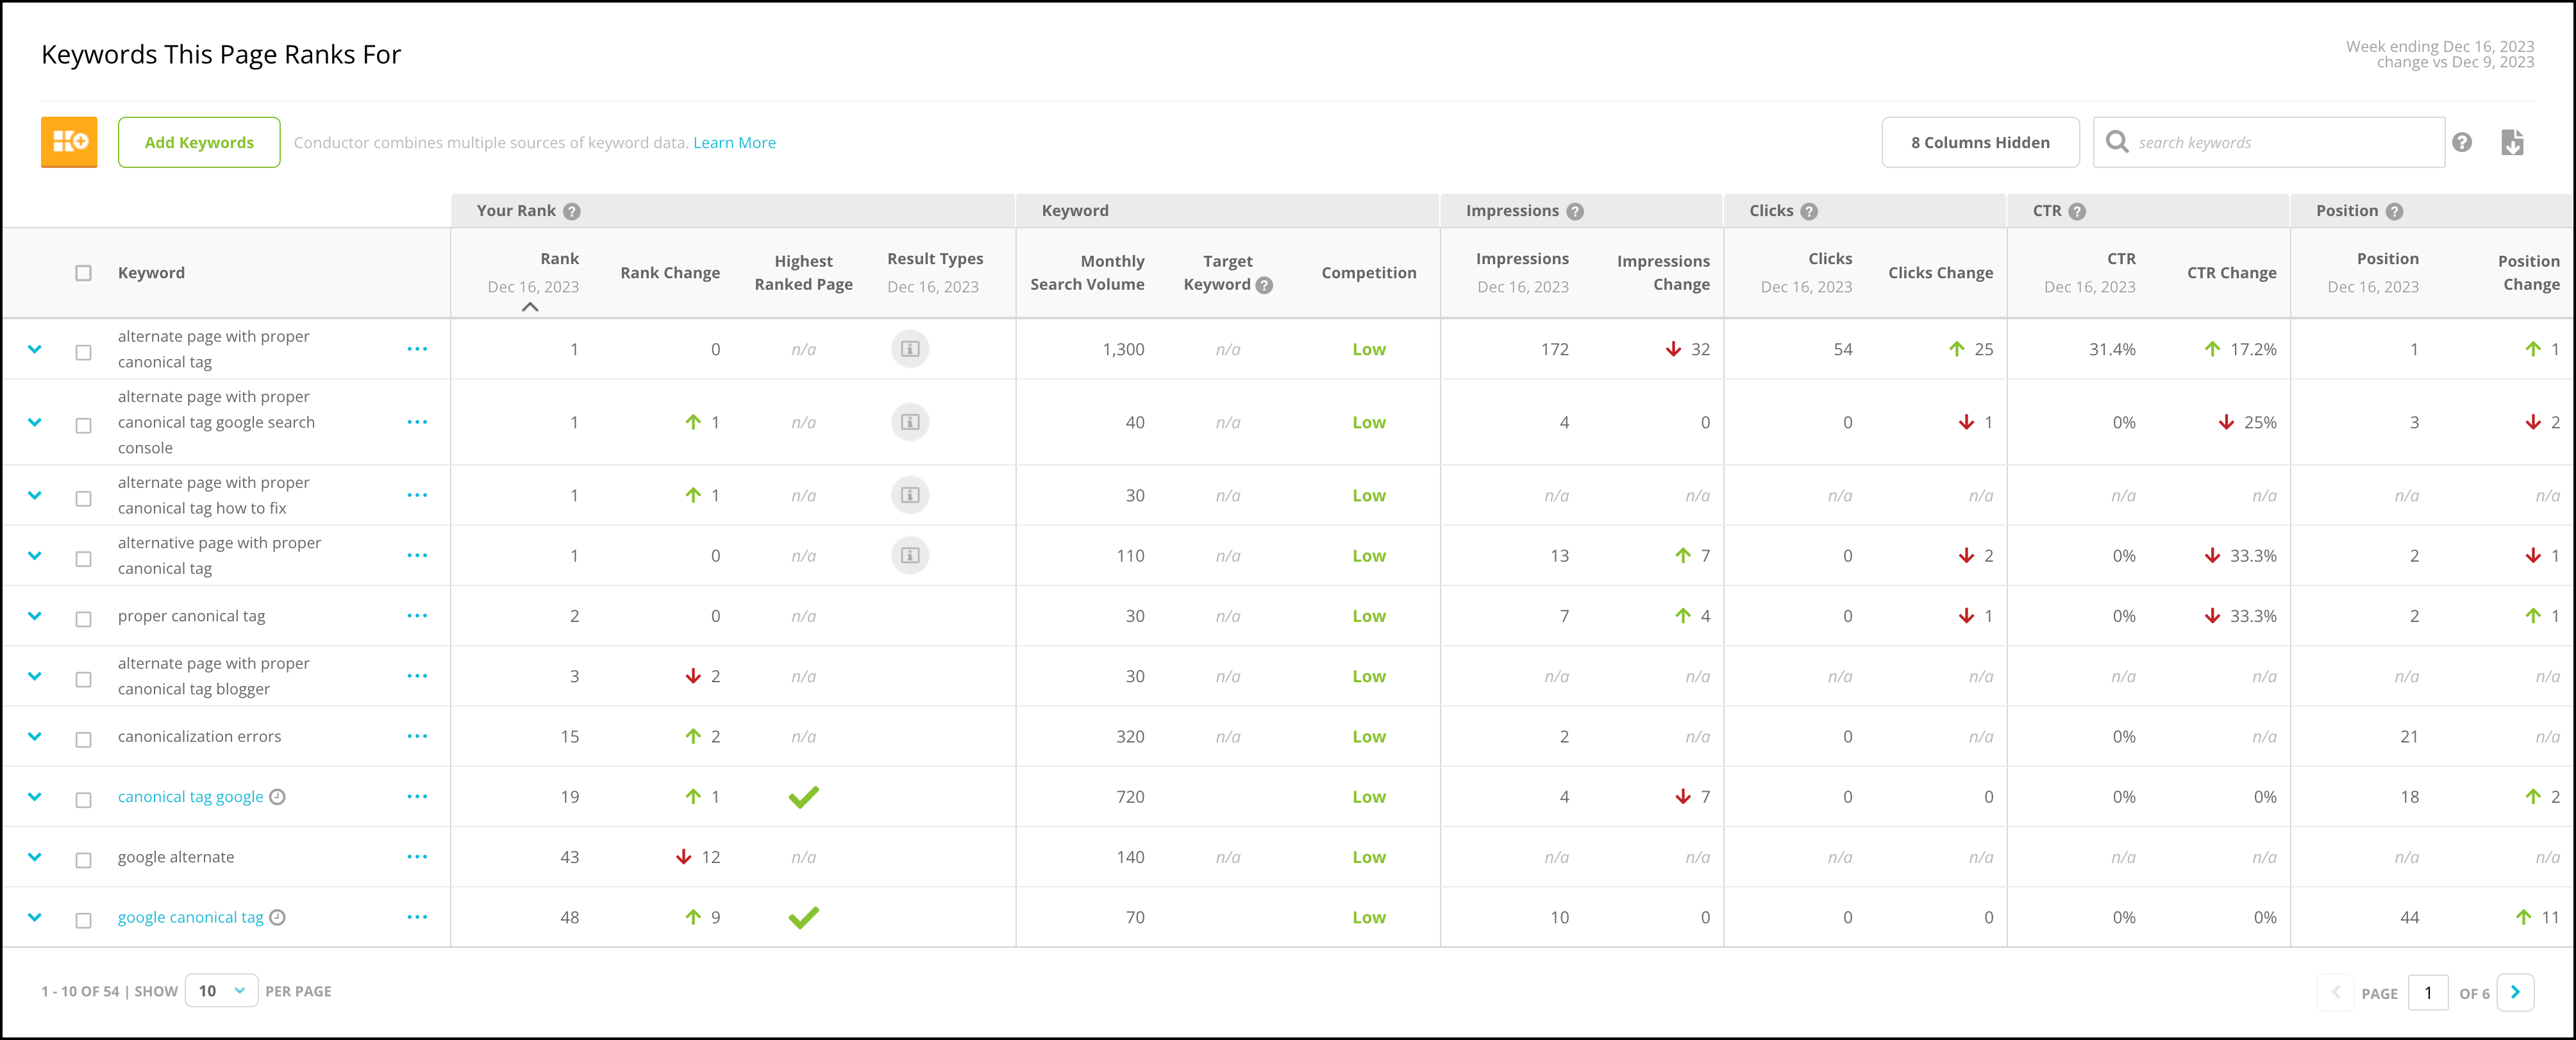
- In the Keyword column, you can click the down arrow to reveal more information about the ranking pages for this keyword:
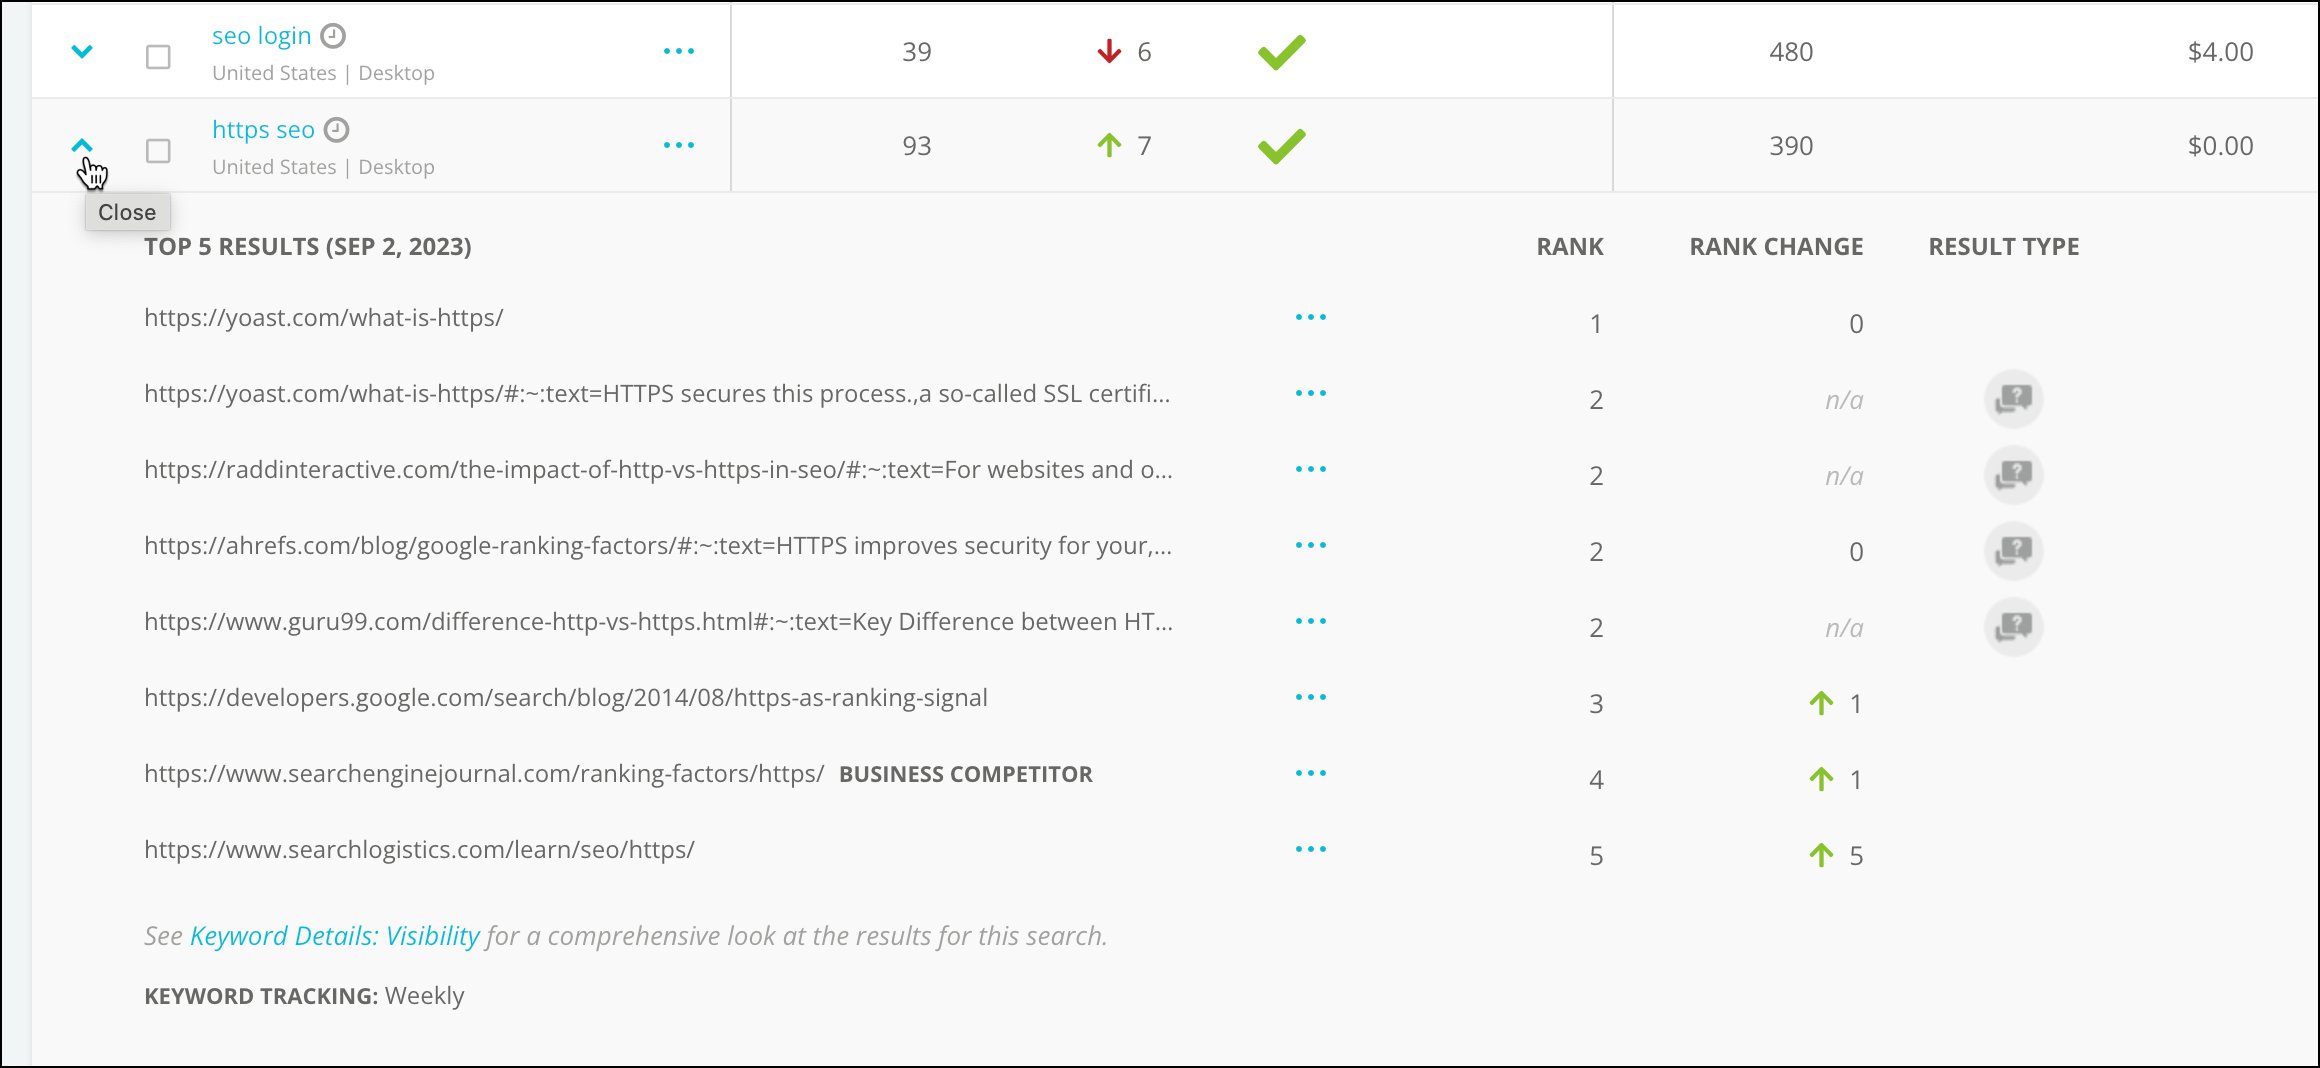
- If you want to dig into a particular keyword, click on its name in the Keywords column to go to the Keyword Details page.

- You can search the table for specific keywords.
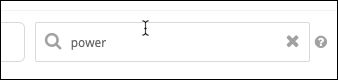
Manage Keywords in the Table
As necessary, you can add keywords to track with Conductor.- Select the check box next to the keywords you want to add.
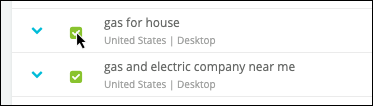
- Click Add Keywords.
Export the Keyword Table
You can export a list of the keywords in this table to a native Microsoft Excel file.