
Storytelling With Data: How to Analyze Data & Communicate SEO Insights
Learn how to take full advantage of your SEO data by analyzing it and communicating your insights effectively to ask for budget and resources.
SEOs are lucky. They are sitting on a goldmine of user information in the form of keywordKeyword
A keyword is what users write into a search engine when they want to find something specific.
Learn More data. Very few people outside search engineSearch Engine
A search engine is a website through which users can search internet content.
Learn More marketing are aware of the untapped potential in the words and phrases that millions of people type into their search boxes every day.
So the problem is not a lack of data, but how to analyze and convey it clearly and effectively. You may be happy to have a spreadsheet filled with pivot tables and MSV data, but it will likely make your CMO's eyes glaze over. And you need executive buy-in to get more resources and support for SEO as a marketing channel.
So how can we use this flood of data to create a strong and compelling narrative? Read on for Conductor’s top tips on how to analyze search data to tell a great story.
Data Collection: Make sure you have a solid keyword set
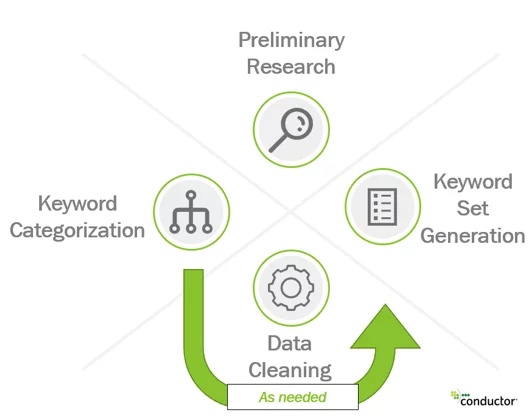
We all know that keyword research is tedious and time-consuming, but I can't stress enough how important it is to have a bulletproof keyword before you start analyzing it. Because this data is the backbone of your story, it needs to be put to the test.
Check every single keyword to make sure it is applicable to the topic. Remove branded searches, spelling mistakes, and navigational queries. Arrange your keywords in thematically relevant categories. The time you spend honing a keyword set in advance can save you hours of frustrating post-hoc cleanup. Software like Conductor can help enormously when it comes to high-quality keyword research.
To bring these ideas to life, I researched about 1,200 keywords relating to business and leisure travel and conducted a sampling analysis for each story below.
Useful Types of Data Storylines
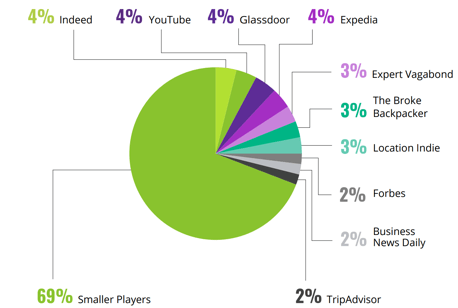
Market share uncovers hidden competition
Market share refers to the percentage of available page 1 search volumeSearch Volume
Search volume refers to the number of search queries for a specific keyword in search engines such as Google.
Learn More owned by different domains. It is the best method of SEO to identify "search competitors," or domains that are not normally considered direct competitors but still have valuable real estate on the SERP.
In my travel example, I found that alongside Expedia and TripAdvisor, small affiliate blogs such as Expert Vagabond have considerable market share on page 1. If I were a travel provider, I would explore using data like this to evaluate prospective partnerships with companies that are already reaching the eyes and ears of my customers.
Search volume reveals customer voice
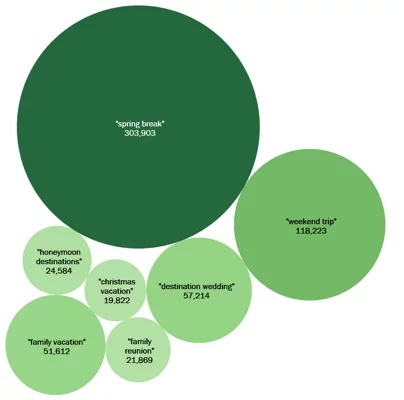
At Conductor, we define “customer voice”
as how your target audience actually searches based on data. By analyzing the search volume for different groups of keywords, we can tell not only how your customers are talking, but also what they are talking about most often.
I investigated the most common types of trips that leisure travelers are searching for. Interestingly, "Spring Break" was by far the most popular trip type, followed by "Weekend Trip" and "Destination Wedding." Any travel company should definitely create landing pages on these high-volume topics, as well as longer-form content that provides value to searchers.
Paid cost comparison helps demonstrate ROI

One useful way to assess the dollar value of a keyword set is to look at the cost of acquiring traffic from paid search.
Looking at my travel keywords, I found that it would cost a whopping $7.2 million a year to acquire even a modest 10% of traffic from the set. Moreover, these PPC costs have increased significantly in the last year; the average keyword bidding cost has increased by about $2 since 2018. Paid search is a reliable but expensive method of acquiring customers. This type of data can be great for conversations with CMOs with large paid budgets to contextualize organic marketing costs.
Local analysis provides granular city-level insights

Every Google search is tied to the place it is performed. By studying local keyword data, we can assess how search demand, performance, and competitionCompetition
Businesses generally know who their competitors are on the open market. But are they the same companies you need to fight to get the best placement for your website? Not necessarily!
Learn More differ in cities and countries around the world.
My analysis found that there is relatively high demand for business travel in major southeastern US cities such as Atlanta, New Orleans, and Miami. While a business travel CMO may know that her biggest markets are New York and LA, she may not have thought of smaller secondary markets where there is a great opportunity to increase their presence. In addition, local data can help inform strategy beyond SEO; it can, for example, help provide data to support a local ad campaign.
Seasonality gives texture to search data

Monthly search volume is typically a rolling average of the last 12 months of search data. By delving deeper into the monthly fluctuations in search volume, we can add nuances to our analysis and provide insights into seasonal fluctuations in demand.
For this analysis, I compared the seasonality of "beach vacation” searchers to that of "ski vacation” searchers." Unsurprisingly, demand for ski holidays is at its highest in December / January, while demand for beaches soars in March and remains higher until August than for ski searchers. While this may seem seasonal data can be an incredibly powerful way to inform your content calendars and optimize campaigns via email and ad marketing.
Conclusion
This is merely a taste of the many ways in which you can use data to tell a story about search. If SEOs can take full advantage of the data that they’re sitting on and communicate effectively, then it will be easier for them to ask for budget and resources. After all, there is no better way to understand your customers than to analyze their own words.